360 Moving Regions of Interest
Overview
This workflow shows how to record and replay a dynamic path for a Region of Interest (ROI) in a 360° video scene. First, you define a static ROI in the GUI, then trace your desired movement path using a debug ball. Next, you capture keyframes with the replay tool, which generates a CSV file. Finally, you replay the path in your main script and can fine tune scale if needed.
Note: As of SightLab 2.5, there is also a separate folder for adding multiple moving regions of interest, such as each moving football player on the field (this requires repeating the below workflow once per region and giving the name of each new .csv file to create for the paths)
Workflow Steps
Define your initial ROI
- Launch
360_moving_RegionsOfInterest.pyand select your 360° video in the GUI. - Add a starting region (“ROI”) where you want the path to begin by clicking the "Add" button, moving the gaze point over your selected area and then pressing the
1key to set a region.
Trace the desired movement path
-
Run:
360_moving_RegionsOfInterest.py -
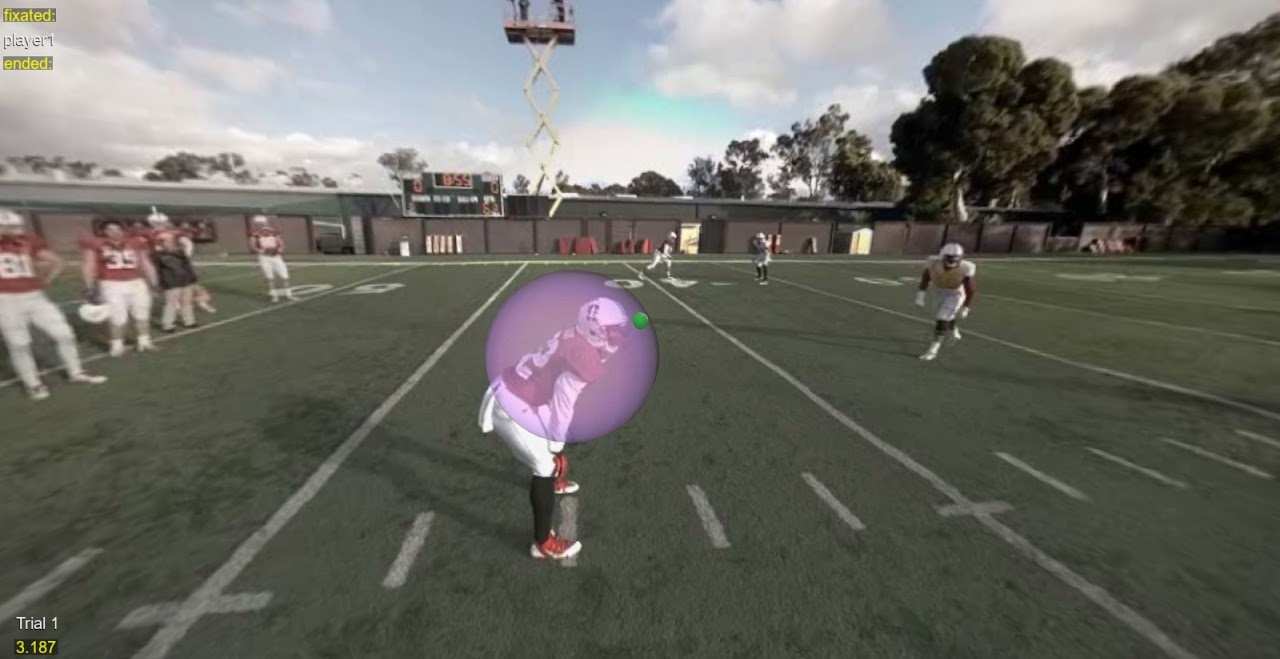
In the Vizard window, use your mouse (and the green debug ball) to follow the path you want your ROI to take. Ignore that the initial region is static at this point.
Capture keyframe points
-
Run:
360_moving_RegionsOfInterest_Tagging.py -
Press keys
1–9to record keyframe positions as you scrub through the video timeline. -
Drag the slider along the bottom to navigate to segments where direction or speed change significantly, then set additional keyframes as needed (note you may need to uncheck "ROIs" so they don't create a distraction).
Save the replay data
- When you exit the replay tool, it automatically writes your keyframes into
moving_regions.csvin the current directory.
Replay and verify
-
Re-run:
360_moving_RegionsOfInterest.py -
The ROI will now move along the captured path. To visualize it, set:
REGION_ALPHA = 0.5
- Observe the movement and ensure it aligns with your intended trajectory.
Adjust path timing
- If you need to tweak timing edit the
Time Differencecolumn inmoving_regions.csv.
Fine‑tune region scale
- If the ROI appears too large or small at certain keyframes, edit the
Scalevalues in the CSV (e.g.,[1,1,1]→[0.8,0.8,0.8]).
Run Session and Collect Data
Run Standard Replay with Visualizations
- Afterwards run
Replay.pyto view the standard replay with visualizations like heatmaps and scan paths.