Street Walking Example
The Street Walking Example demonstrates how SightLab can be used to create an immersive single or multi-user pedestrian study while simultaneously recording eye tracking, participant movement, environmental conditions, traffic behavior, and experiment events.
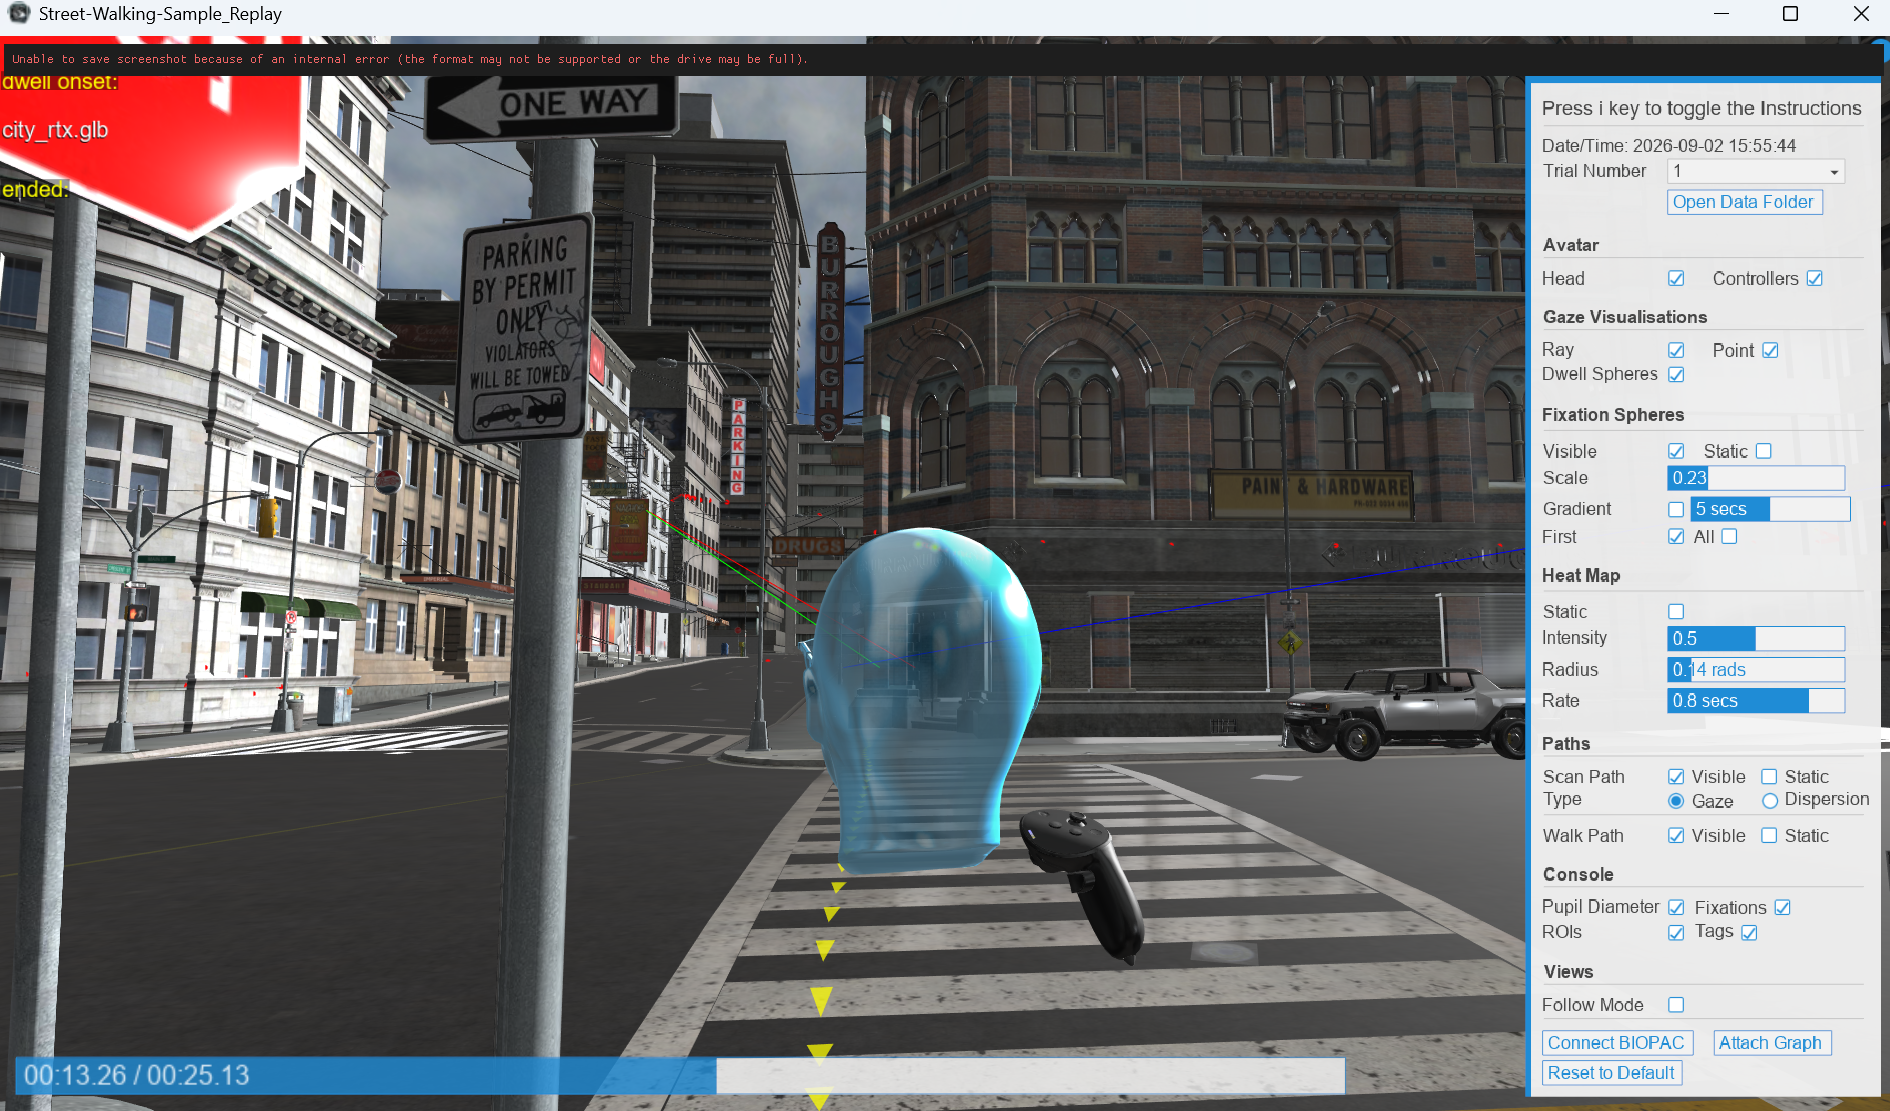
The example can be used as a starting point for studies involving:
- Pedestrian attention and street-crossing behavior
- Visual attention to vehicles, signs, pedestrians, and hazards
- Traffic-density comparisons
- Vehicle-speed manipulations
- Environmental or weather conditions
- Different street layouts or maps
- Spatial navigation and walking behavior
- Multi-user pedestrian studies
- Eye tracking and fixation analysis
- Behavioral, survey, and demographic data collection
Overview
In this example, participants can physically or virtually move through a street environment while SightLab records their experience.
Researchers can manipulate characteristics of the simulation such as:
- Number of vehicles
- Vehicle speed
- Traffic density
- Trial condition
- Street or map configuration
- Weather or environmental appearance
- Audio environment
- Objects or Regions of Interest
- Trial duration
- Starting location
- Participant instructions
At the same time, SightLab can collect behavioral and eye-tracking information for later analysis.
Image Placeholder — Street Environment

The supplied example includes configurable traffic and adds the vehicles as gaze-tracked scene objects, allowing participant attention to individual cars to be analyzed.
Running the Street Walking Study
The Street Walking Example uses the normal SightLab trial workflow.
A typical study might consist of multiple trials where each trial changes one or more conditions.
For example:
| Trial | Traffic | Vehicle Speed | Weather | Map |
|---|---|---|---|---|
| 1 | 0 cars | — | Clear | Street A |
| 2 | 1 car | 10 m/s | Clear | Street A |
| 3 | 2 cars | 10 m/s | Clear | Street A |
| 4 | 2 cars | 15 m/s | Rain | Street A |
| 5 | 2 cars | 15 m/s | Rain | Street B |
These conditions can then be stored alongside the participant's behavioral and eye-tracking data.
Image Placeholder — Experimental Conditions

Traffic Conditions
The example supports manipulating the number of vehicles present during a trial.
A stimulus/condition file can determine how many vehicles should appear.
For example:
Trial 1 → 0 vehicles
Trial 2 → 1 vehicle
Trial 3 → 2 vehicles
Individual vehicles can also be registered as SightLab scene objects.
This allows researchers to examine questions such as:
- Did the participant look at the approaching vehicle?
- How long did they look at it?
- How many separate times did they view it?
- At what point in the trial did they first notice it?
- Where was the participant when the vehicle was observed?
- What was the traffic condition at that moment?
Image Placeholder — Traffic Conditions

Vehicle Speed
Vehicle movement speed is explicitly controlled by the Street Walking example.
This makes it possible to experimentally manipulate vehicle behavior rather than relying on a static street scene.
For example, researchers could compare:
Slow vehicle     → 5 m/s
Medium vehicle   → 10 m/s
Fast vehicle     → 15 m/s
The configured vehicle speed can also be stored as an experimental condition so that gaze and behavioral responses can be analyzed in relation to traffic speed.
This enables questions such as:
- Does increasing vehicle speed change when participants look toward traffic?
- Do participants spend longer looking at faster vehicles?
- Does walking behavior change as traffic speed increases?
- Does the participant stop, slow down, or change direction?
Image Placeholder — Vehicle Speed

Environmental Conditions
The same trial-based design can be extended to environmental manipulations.
Possible conditions include:
- Clear weather
- Fog
- Day versus night
- Lighting levels
- Visibility
- Different road layouts
- Different maps
- Urban versus suburban environments
- Different sidewalk configurations
- Construction or temporary obstacles
These conditions are not limited to eye-tracking experiments. They can be included as experimental variables and stored with the rest of the trial data for later analysis.
For example:
Participant: P014
Trial: 4
Map: Downtown_A
Weather: Rain
Traffic_Count: 2
Vehicle_Speed: 15
Image Placeholder — Weather Comparison
Image Placeholder — Map Variations

Audio
The Street Walking Example also includes environmental audio.
For example, the supplied script loads a looping city ambience audio file during the trial.
Audio can therefore be used to create a more realistic streetscape or manipulated as an experimental variable.
Examples include:
- General city ambience
- Traffic noise
- Vehicle engines
- Horns
- Sirens
- Pedestrian signals
- Construction sounds
- Rain or wind
- Spoken instructions
Image Placeholder — Spatial Audio

Eye Tracking and Visual Attention
Objects in the environment can be designated as objects of interest for SightLab eye-tracking analysis.
For the Street Walking Example, individual vehicles can be registered for gaze tracking.
This makes it possible to analyze attention to specific objects such as:
- Cars
- Buses
- Cyclists
- Pedestrians
- Traffic lights
- Crosswalks
- Road signs
- Buildings
- Storefronts
- Hazards
- Regions of the roadway
SightLab can then associate gaze behavior with those objects and Regions of Interest.
Image Placeholder — Gaze Tracking

Participant Movement
SightLab can record the participant's tracked movement through the environment.
This makes it possible to reconstruct not only what someone looked at, but also where they were and how they moved while looking at it.
Movement-related measures can include recorded position/orientation data and derived measures such as:
- Walking path
- Position over time
- Direction of travel
- Distance traveled
- Movement velocity
- Changes in velocity
- Stops and pauses
- Turning behavior
- Relationship between participant and vehicle position
This is particularly useful for pedestrian research because gaze and movement can be examined on the same timeline.
For example:
A participant slows while approaching the curb, looks left toward a fast-moving vehicle, waits for the vehicle to pass, and then continues across the street.
SightLab's recorded data and Session Replay allow these events to be examined together.
Data Collection and Export
SightLab records experiment data that can be exported for additional analysis.
The data pipeline can include several complementary files rather than only a single summary spreadsheet.
Depending on the enabled recording options, this can include:
Raw Tracking Data
Frame-by-frame or sample-level information used to reconstruct the participant's session.
This can include tracked information associated with:
- Head/user position
- Head/user orientation
- Eye gaze
- Gaze intersection
- Tracked objects
- Controllers or other tracked devices
- Trial time
- Participant movement
Eye-Tracking Data
Depending on the eye tracker and experimental configuration:
- Gaze position
- Gaze direction/orientation
- Gaze intersections
- Object being viewed
- Fixations
- Saccades
- Dwell behavior
- View counts
- Timing information
Fixation Data
SightLab performs fixation/saccade analysis and can generate fixation-specific timeline information.
This allows analysis of:
- Fixation location
- Fixation timing
- Fixation duration
- Sequences of visual attention
Trial Timeline
A chronological representation of events occurring during the trial.
This is useful when relating:
Participant movement
        ↓
Vehicle approaches
        ↓
Participant fixation on vehicle
        ↓
Participant slows/stops
        ↓
Vehicle passes
        ↓
Participant continues walking
Experiment Summary
Aggregated metrics and custom experiment values can also be stored.
For the street example, custom values might include:
Participant_ID
Trial
Map
Weather
Traffic_Count
Vehicle_Speed
Average_Walking_Speed
Rating
Replay Data
SightLab also saves the information necessary to reconstruct the session inside Session Replay.
Image Placeholder — Data Files

The exported data can subsequently be analyzed using tools such as:
- Python
- R
- MATLAB
- Excel
- SPSS
- AI-assisted analysis workflows
- Custom research pipelines
Session Replay
One of the major advantages of the Street Walking Example is that the session does not have to be understood only through spreadsheets.
SightLab Session Replay reconstructs the participant's recorded session inside the original virtual environment.
Researchers can move through the replay timeline and inspect gaze and movement spatially.
Image Placeholder — Session Replay Overview

Replay visualization options include:
- Participant/avatar movement
- Walk paths
- Scan paths
- Gaze points
- Gaze rays
- Fixation points
- Dwell visualizations
- Heatmaps
- ROI labels
- Trial playback
- Multiple participant/client visualization
Walk Paths
The Walk Path visualization shows the participant's physical trajectory through the street environment.
Instead of examining only X/Y/Z position values in a spreadsheet, the complete route can be visualized directly in 3D.
Image Placeholder — Walk Path

This can make behaviors immediately visible, such as:
- Hesitation near a curb
- Stepping toward the roadway and backing away
- Route deviations
- Different crossing locations
- Movement around obstacles
- Differences between experimental conditions
The replay can show the walk path dynamically during playback or display the accumulated path for spatial inspection.
Scan Paths
The Scan Path visualization shows how visual attention moved through the scene.
Image Placeholder — Scan Path

SightLab Replay supports multiple ways of examining gaze paths, including representations based on:
- Continuous gaze
- Saccadic movement
- Dispersion/fixation-based gaze behavior
This helps answer not just what was viewed, but in what order.
For example:
Crosswalk
   ↓
Approaching car
   ↓
Traffic light
   ↓
Opposite sidewalk
   ↓
Approaching car
That sequence can reveal strategies participants use when deciding whether it is safe to cross.
Fixations
SightLab can visualize calculated fixation locations within the environment.
Image Placeholder — Fixation Points

Fixations provide a spatial representation of locations where visual attention remained relatively stable.
They can be analyzed alongside:
- Fixation duration
- Fixation sequence
- Object of fixation
- Participant position
- Traffic condition
- Vehicle speed
- Trial condition
This makes it possible to examine a participant's visual decision-making process while they move through the scene.
Heatmaps
SightLab Session Replay can create heatmap visualizations showing where visual attention was concentrated.
Image Placeholder — Heatmap

Heatmaps are useful for quickly identifying areas receiving more or less visual attention.
For example:
- Are participants primarily looking at vehicles?
- Are they checking the traffic signal?
- Does attention shift toward the roadway under high traffic?
- Does fog produce more concentrated visual search?
- Do fast vehicles attract attention earlier?
- Do experienced and inexperienced participants look at different locations?
Heatmaps complement the raw numerical gaze data by making spatial patterns immediately visible in the scene where they occurred.
Replay Multiple Participants
SightLab Replay is also designed to handle multi-user recordings.
That means the same replay framework can be used to inspect recordings from multiple users and selectively display participant/client visualizations.
This is particularly useful for studies involving:
- Multiple pedestrians
- Pedestrian-to-pedestrian interaction
- Group navigation
- Shared decision making
- Pedestrian and driver interaction
- Instructor/student experiments
- Collaborative VR tasks
Image Placeholder — Multi-User Replay

Multi-User Studies
The Street Walking workflow can natively use SightLab's server/client multi-user architecture.
The supplied example includes separate:
Street-Walking-Sample_Server.py
Street-Walking-Sample_Client.py
This allows multiple participants to occupy the same synchronized experiment.
A server coordinates the study while one or more clients participate.
Image Placeholder — Multi-User Street Study

Possible applications include:
- Two pedestrians deciding when to cross
- Group navigation
- Social influence on crossing behavior
- Pedestrian/driver experiments
- Collaborative search tasks
- Crowd behavior
- Instructor and participant scenarios
Because this is built on SightLab's multi-user framework, the study can also take advantage of SightLab's other multi-user features and examples, including avatars, synchronized trials, presentation control, audio-related workflows, and replay.
Rating Scales and Surveys
The Street Walking experiment can use SightLab's normal rating-scale tools.
For example, after crossing the street:
yield sightlab.showRatings(
    "How safe did you feel crossing the street?",
    ratingScale=["1", "2", "3", "4", "5"],
    pauseTimer=True
)
Possible questions include:
- How safe did the crossing feel?
- How difficult was it to judge vehicle speed?
- How realistic was the traffic?
- How confident were you in your decision?
- How stressful was the crossing?
- How aware were you of surrounding traffic?
Rating responses can be saved with the participant's experiment data.
Image Placeholder — Rating Scale

Instructions
SightLab's normal instruction system can also be incorporated into the Street Walking study.
For example:
Walk along the sidewalk. When you believe it is safe, cross the street and continue to the marked destination.
Instructions can be displayed:
- At the beginning of the experiment
- Before individual trials
- Between conditions
- Following a particular event
- Before a questionnaire
- At the end of the study
Image Placeholder — Participant Instructions

Demographics and Participant Information
Participant information can also be collected as part of the same experiment.
SightLab examples demonstrate using input dialogs to collect demographic or questionnaire information and save values into the experiment summary.
Potential variables include:
Age
Gender
Driving experience
Walking frequency
Familiarity with the area
Vision correction
VR experience
Participant group
Condition group
Researchers can therefore combine participant characteristics with behavioral and eye-tracking measures.
For example:
Age
        +
Driving Experience
        +
Traffic Condition
        +
Vehicle Speed
        +
Walking Velocity
        +
Fixation Behavior
        +
Safety Rating
Image Placeholder — Demographic Questionnaire

Other SightLab Features
Because the Street Walking study is a normal SightLab experiment, it is not limited to the functionality demonstrated in the basic sample.
Other SightLab capabilities can be incorporated as needed, including:
- Regions of Interest
- Dwell time
- View counts
- Average dwell time
- Fixation analysis
- Gaze-based interactions
- Object grabbing and interaction
- Proximity sensors
- Hand tracking
- Full-body avatars
- Foot tracking
- Face tracking
- Biofeedback
- BIOPAC integration
- Lab Streaming Layer
- External data synchronization
- Screen recording
- Custom experiment events
- Trial randomization
- Adaptive experiments
- AI-assisted analysis
- AI agents
- Participant instructions
- Rating scales
- Surveys
- Demographic collection
- Multi-user avatars
- Audio
- Custom Python libraries and experiment logic
Image Placeholder — SightLab Feature Ecosystem

This makes the Street Walking Example useful as both a finished demonstration and a starting template for more specialized pedestrian, transportation, perception, or human-factors research.
Example Research Questions
The combined system can support research questions such as:
Visual Attention
- When does a participant first notice an approaching vehicle?
- How often does the participant check traffic before crossing?
- Which objects receive the greatest fixation time?
- Does visual search behavior change as vehicle speed increases?
Pedestrian Movement
- How quickly does a participant approach the road?
- Where does the participant stop before crossing?
- How long do they hesitate?
- Does their walking velocity change when a vehicle approaches?
Traffic
- Does increasing traffic density affect crossing decisions?
- How does vehicle speed affect visual attention?
- How does the number of vehicles alter scan behavior?
Environmental Conditions
- Does rain alter walking speed?
- Does fog increase fixation duration?
- Do participants behave differently at night?
- Does a different road layout change visual search?
Subjective Experience
- Which conditions feel safest?
- Which conditions are perceived as most realistic?
- Does perceived safety match measured behavior?
Multi-User Behavior
- Does another pedestrian influence crossing behavior?
- Do participants follow another person's decision?
- Where do users look during social interaction?
- How does group movement alter attention to traffic?
Example Study Workflow
A complete Street Walking experiment could follow this workflow:
1. Collect participant information
            ↓
2. Show experiment instructions
            ↓
3. Load experimental condition
   • Map
   • Weather
   • Traffic count
   • Vehicle speed
   • Audio
            ↓
4. Start SightLab recording
            ↓
5. Participant walks through street
            ↓
6. Record simultaneously
   • Eye tracking
   • Fixations
   • Gaze intersections
   • Head/user movement
   • Position
   • Traffic conditions
   • Vehicle behavior
   • Trial events
            ↓
7. End trial
            ↓
8. Present rating scale/questionnaire
            ↓
9. Continue to next condition
            ↓
10. Export experiment data
            ↓
11. Open Session Replay
            ↓
12. Analyze
    • Walk paths
    • Scan paths
    • Fixations
    • Heatmaps
    • Raw tracking data
    • Trial summaries
    • Multi-user behavior
Image Placeholder — Study Workflow

Related SightLab Documentation
For additional information, see the SightLab documentation:
- SightLab Documentation: https://help.worldviz.com/sightlab/
- Session Replay: https://help.worldviz.com/sightlab/session-replay/
- Example Scripts: https://help.worldviz.com/sightlab/example-scripts/
- Adding Instructions: https://help.worldviz.com/sightlab/adding-instructions/
- Multi-User Custom Experiments: https://help.worldviz.com/sightlab/multi-user-custom-experiments/
- Driving / Vehicle Examples: https://help.worldviz.com/sightlab/driving-example/
Summary
The Street Walking Example demonstrates how a pedestrian VR experiment can combine environmental manipulation, moving traffic, audio, eye tracking, participant movement, raw data collection, and interactive Session Replay in one research workflow.
The experiment can scale from a relatively simple single-user crossing study to a complex multi-condition or multi-user research platform.
After data collection, researchers can move beyond spreadsheets and reconstruct the participant's experience directly in the virtual environment, visualizing:
where they walked, where they looked, what they fixated on, how their gaze moved, how attention was distributed across the environment, and how those behaviors related to traffic and experimental conditions.