Street Walking Example
The Street Walking Example demonstrates how SightLab can be used to create an immersive single- or multi-user pedestrian study while simultaneously recording eye tracking, participant movement, traffic behavior, and experiment events.
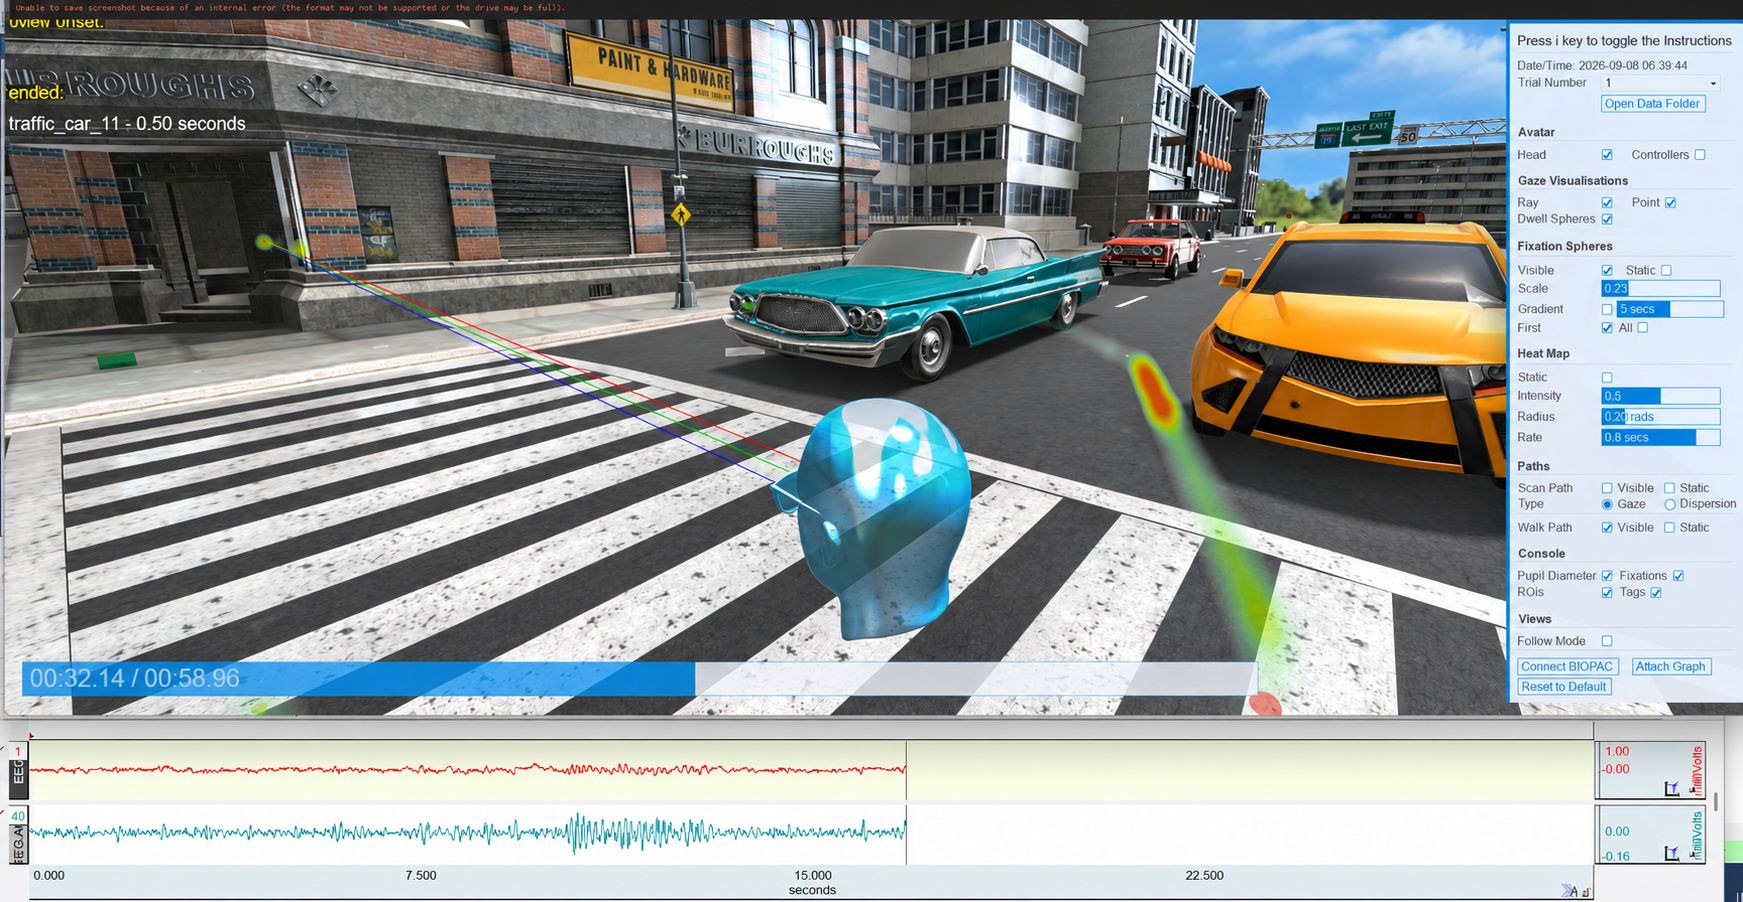
The example is a useful starting point for studies involving:
- Pedestrian attention and street-crossing behavior
- Visual attention to vehicles, signs, pedestrians, and hazards
- Traffic-density comparisons
- Vehicle-speed manipulations
- Spatial navigation and walking behavior
- Multi-user pedestrian studies
- Eye tracking and fixation analysis
- Behavioral, survey, and demographic data collection
Overview
Participants physically or virtually move through a street environment while SightLab records their experience — and the example demonstrates a wide slice of what SightLab can do for pedestrian and traffic research in one working setup:
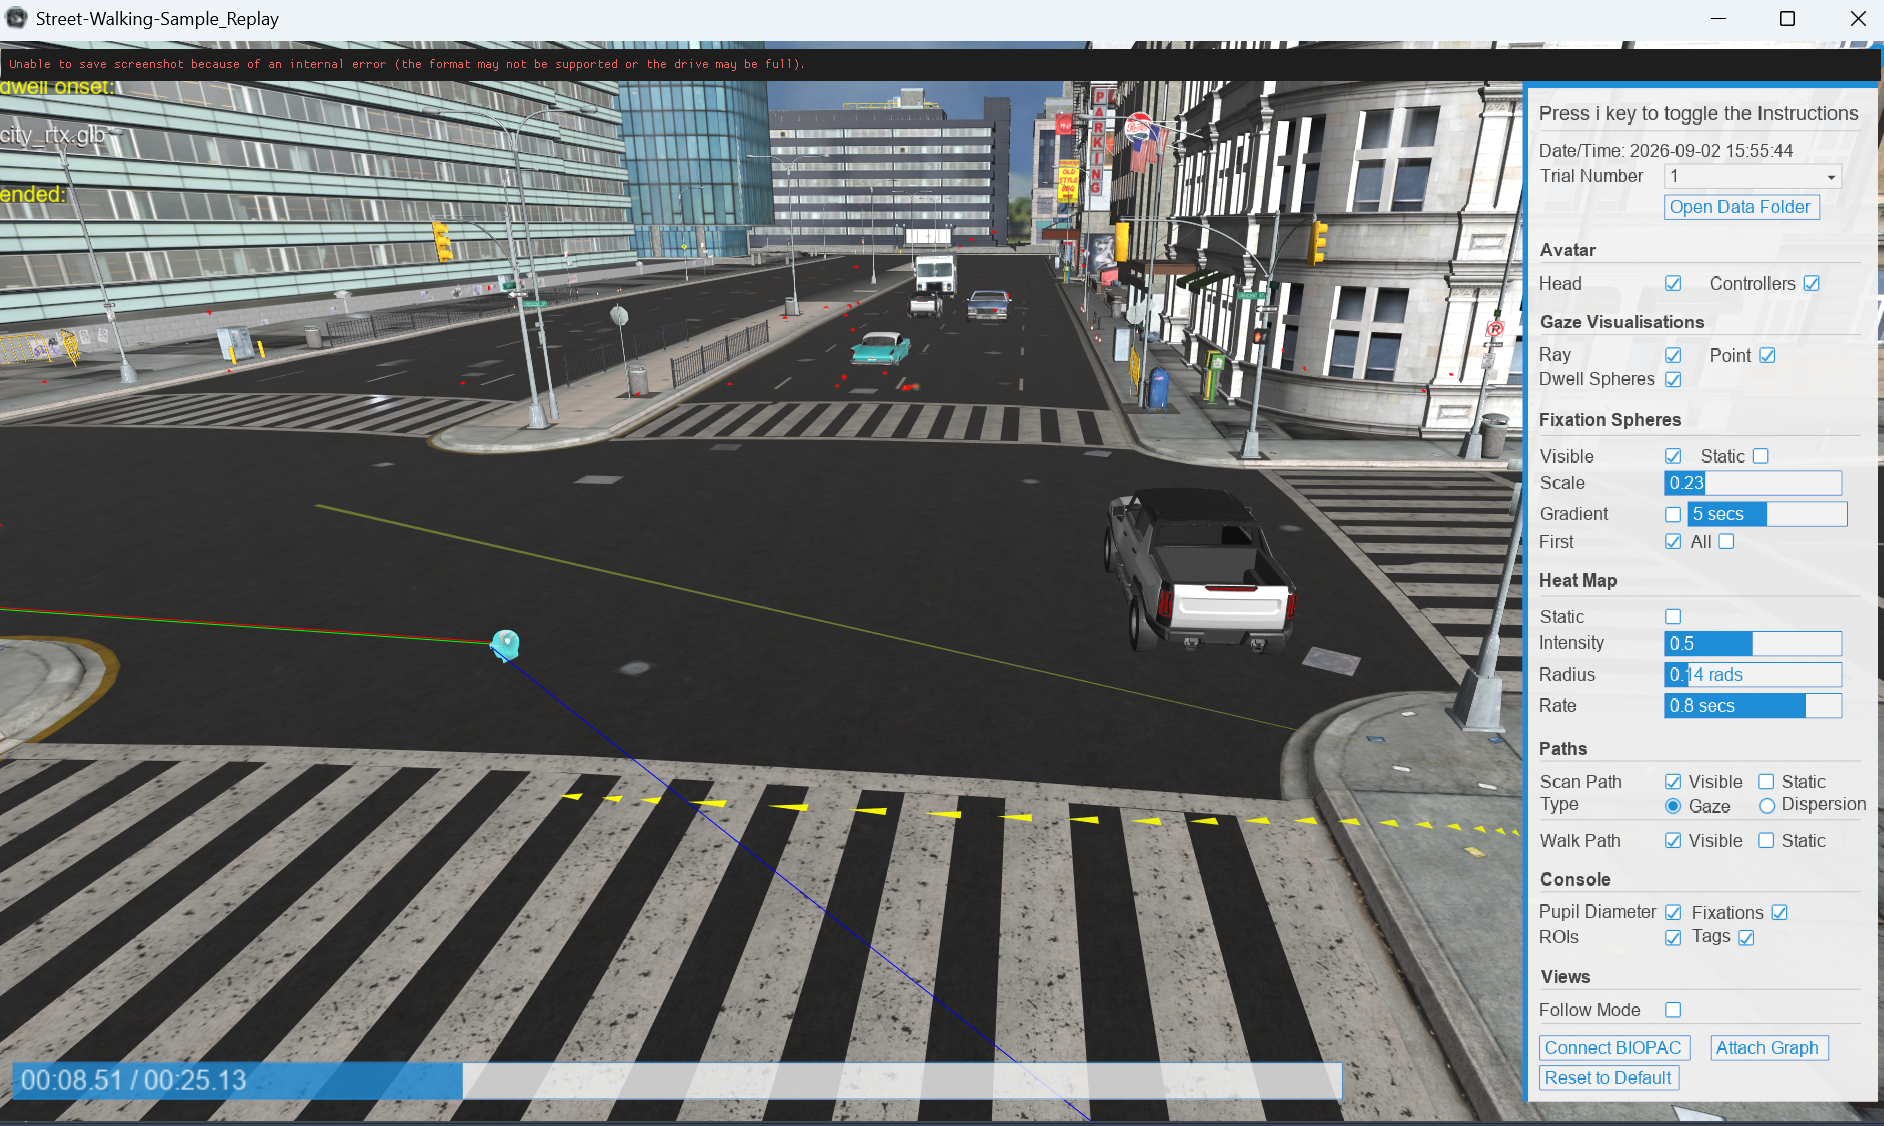
- Real traffic flow — vehicles follow recorded routes on any environment, keep their distance, stop at traffic lights (each with matching pedestrian walk / hand signals), brake for the participant, and never drive through walls or each other; vehicle count, speed, lights, and yielding vary per trial from a simple condition file (see Traffic System)
- Optional additional pedestrians — animated avatars walk sidewalk routes and pause when the participant approaches their path; vary their count and speed by trial (see Optional Pedestrian System)
- Flexible trial ending — end trials on a proximity event, a timer, a key press, or a combination
- Immersive audio — ambient city sound built in, with room to layer in traffic noise, sirens, or spoken instructions
- Eye tracking on real objects — vehicles, and anything else in the scene, can be registered as gaze-tracked Regions/Objects of Interest, so attention to individual cars, signs, or hazards can be measured directly
- Full participant movement tracking — walking path, position, velocity, and turning behavior recorded alongside gaze on the same timeline, with support for full-body tracked avatars in addition to standard head and hand tracking
- Rich data export — raw tracking, eye-tracking, fixation, and trial-timeline data, plus a summarized experiment export (including average walk speed, walk velocity, traffic count, fixation count, and more), ready for Python, R, MATLAB, Excel, or SPSS
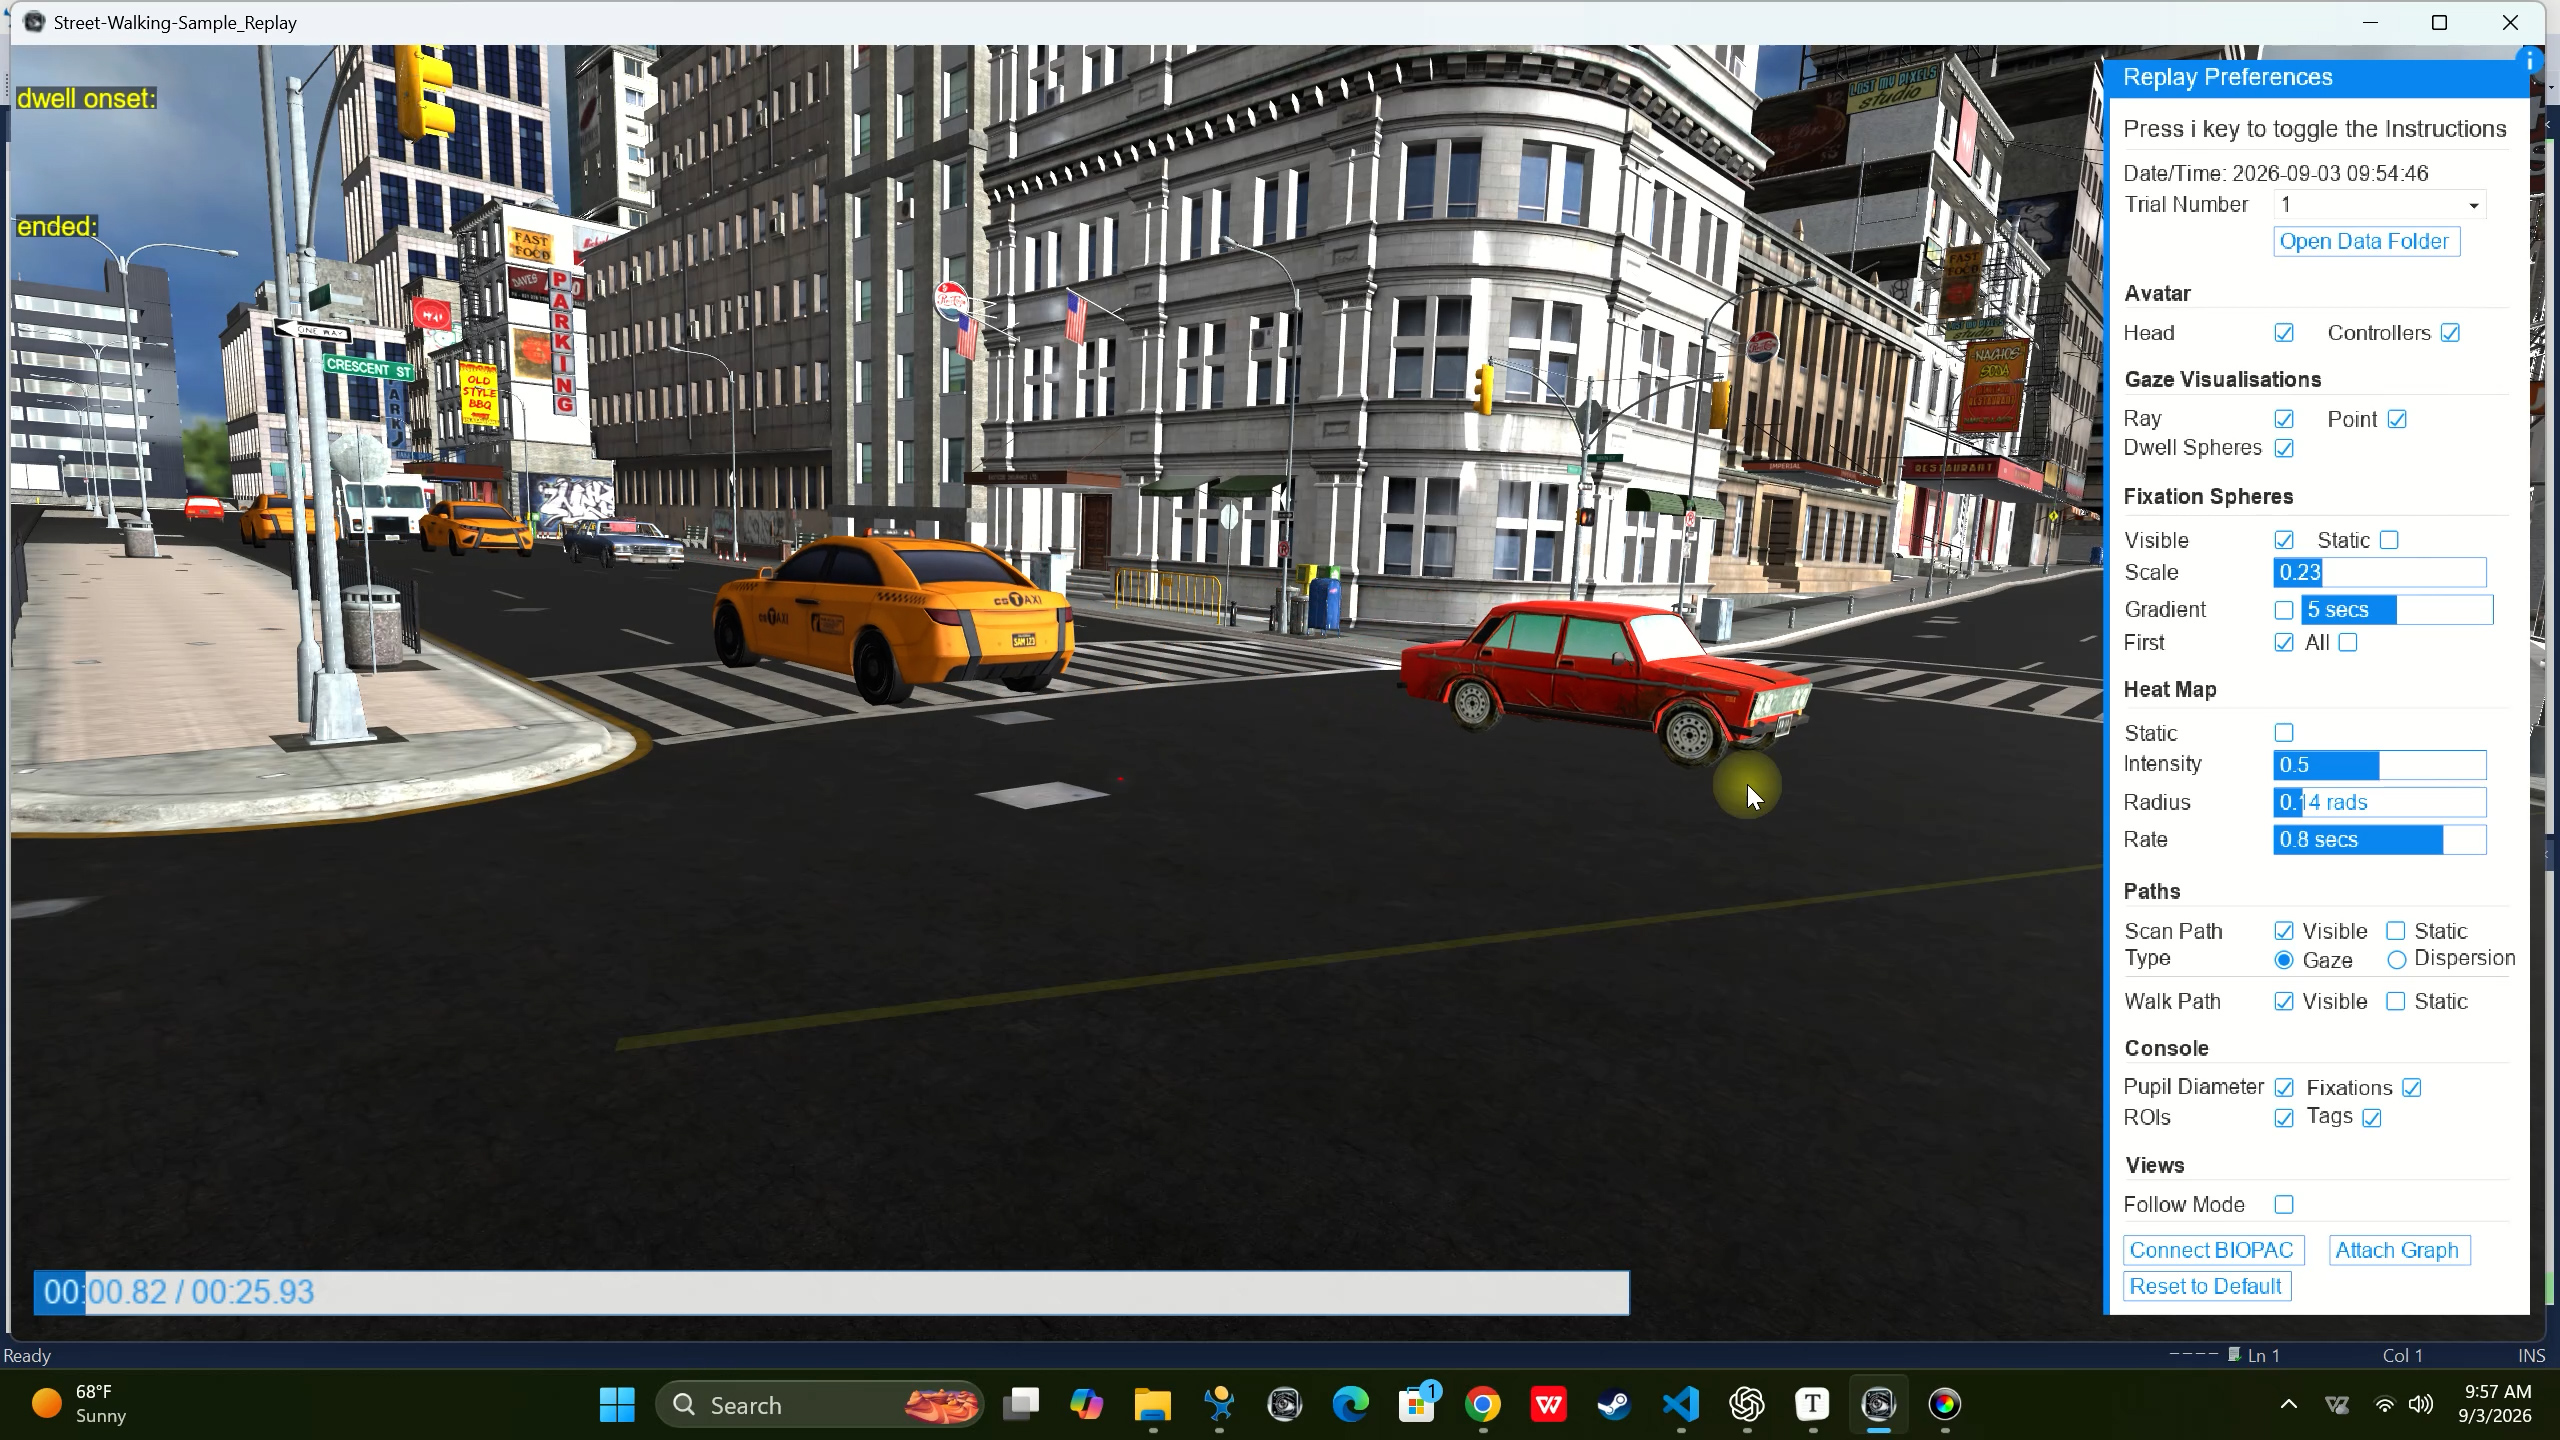
- Session Replay — walk paths, scan paths, fixations, and heatmaps visualized directly inside the original 3D environment, not just as spreadsheet rows
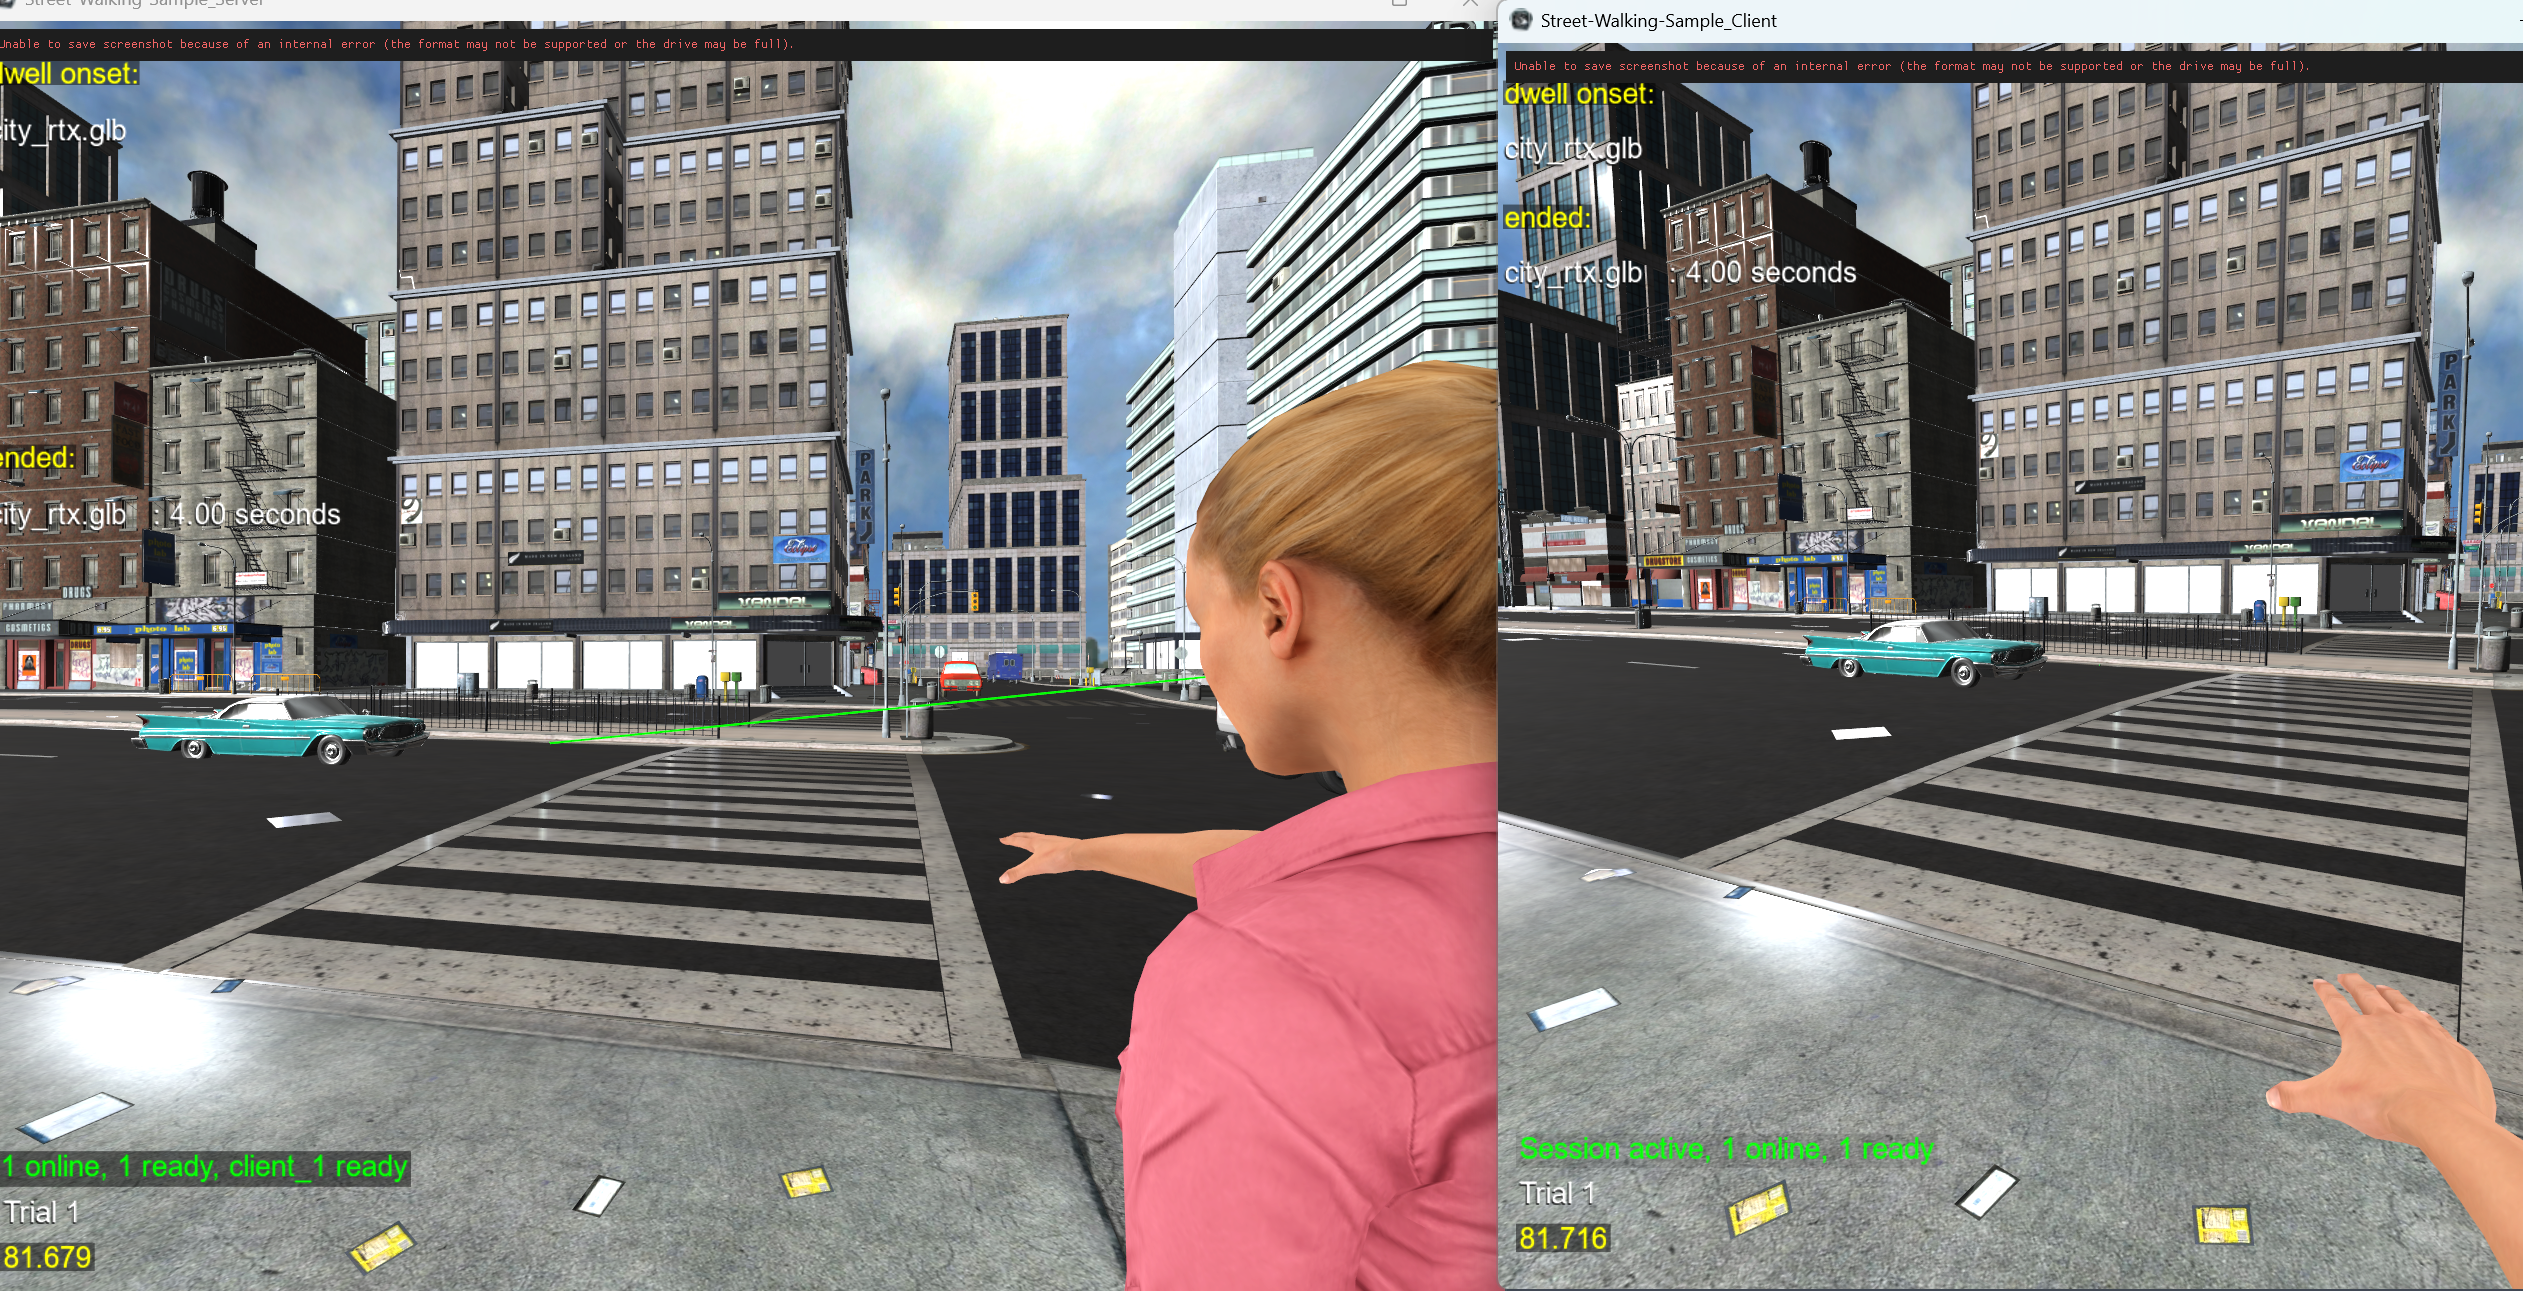
- Multi-user support — the same experiment can run as a synchronized, multi-participant study
- Participant input — rating scales, instructions, and demographic questionnaires drop into the same trial workflow
- The rest of the SightLab platform — hand/foot/face tracking, avatars, biofeedback integrations, adaptive trials, and more are all available to layer on top
The project folder includes:
| File | Purpose |
|---|---|
Street-Walking-Sample.py |
Single-user experiment |
Street-Walking-Sample_Server.py / _Client.py |
Multi-user version using SightLab's server/client framework |
Street-Walking-Sample-NonGUI-STIM.py |
Non-GUI (auto-start) version that reads its trial conditions from a STIM/spreadsheet file (Resources/stim_file-non-GUI.csv) instead of the GUI config tool. |
Street-Walking-Sample_Replay.py |
Opens recorded sessions in Session Replay |
traffic_config.py |
Traffic and optional pedestrian settings: enable switches, pools, speeds, signal timing, yielding, avatar animations, recorder keys |
modules/traffic/ |
The reusable traffic and pedestrian systems (routes, vehicles, lights, pedestrian signals, animated pedestrians, simulation, route recorder) |
modules/walking_speed.py |
Measures the participant's walking speed (see Walking Speed) |
modules/trial_gc.py, modules/frame_profiler.py |
Keep Python's garbage collector from freezing frames during a trial, and report where each frame's time goes (see Configuration) |
Resources/traffic/ |
One route file per environment (street_day.json and street__night.json included; others are recorded in-app) |
Resources/vehicles/ |
Vehicle models; every model in this folder is used as traffic |
Resources/pedestrian_signals/ |
Pedestrian signal models (walk, hand, and dark), mounted automatically on every traffic light |
Resources/pedestrians/ |
Animated avatar models for optional additional pedestrians |
The sections below cover each of these in more detail, including how they can be extended for a specific study.
Running the Street Walking Study
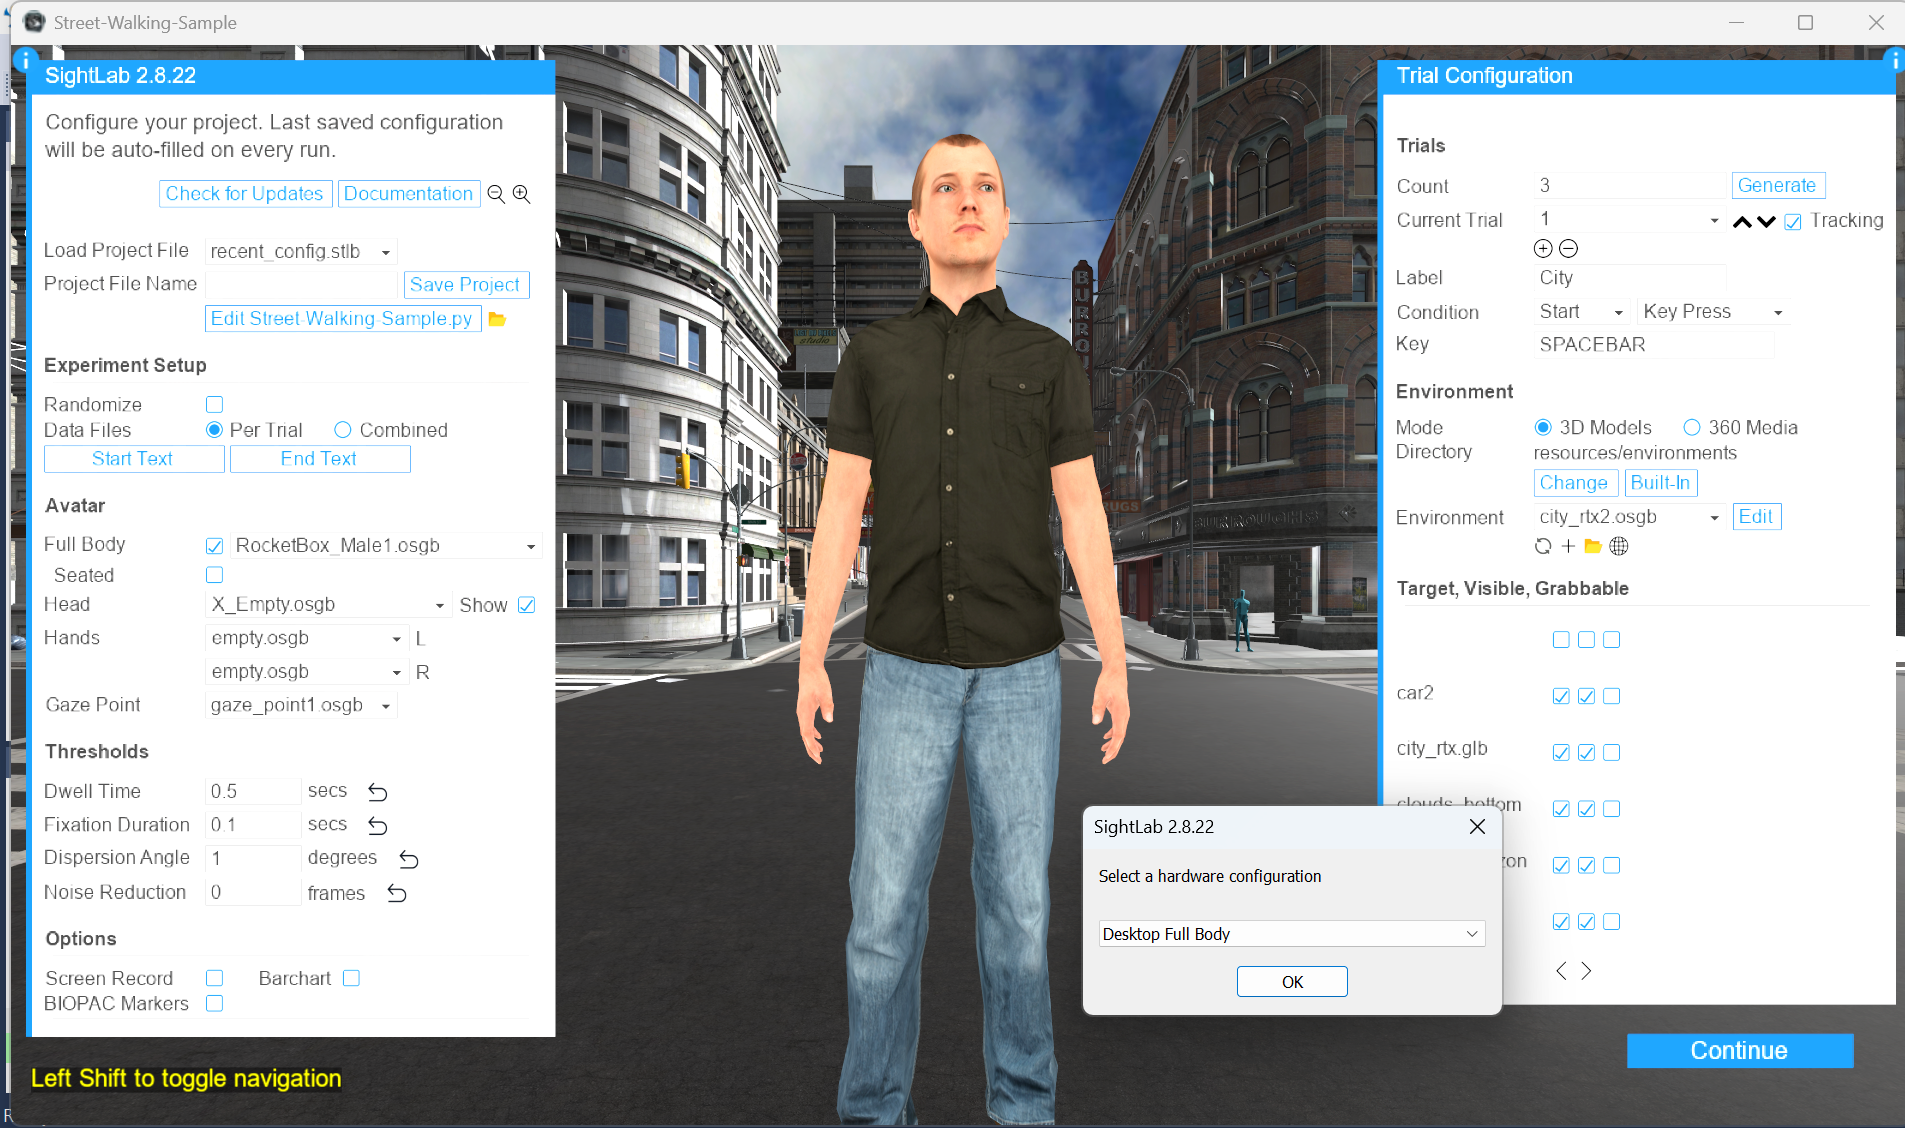
The Street Walking Example uses the normal SightLab trial workflow: each trial loads a row of conditions, plays out, and is recorded.
A stimulus/condition file is a convenient way to define those conditions per trial — one row per trial, one column per condition. The supplied Resources/stim_file.csv is an example:
| Trial | number of vehicles | traffic speed | traffic lights | yield to pedestrian | number of pedestrians |
|---|---|---|---|---|---|
| 1 | 15 | 10 | on | on | 0 |
| 2 | 10 | 12 | off | on | 3 |
| 3 | 7 | 8 | on | off | 3 |
The four traffic columns are read by the traffic system (see Traffic System). number of pedestrians controls the optional simulated avatars, excluding the participant and other human users (see Optional Pedestrian System). Further conditions — a starting point, weather, audio, instructions, or anything else a study needs — can be added as columns the same way and read via StimReader.
These conditions can be stored alongside the participant's behavioral and eye-tracking data for later analysis.
Ending a Trial
The shipped scripts end each trial on a key press (the GUI version uses whatever End condition is set in the trial settings). Any of the following can be used instead, or combined so the trial ends on whichever happens first:
- Proximity event — end when the participant reaches a waypoint, crosses to the far sidewalk, or a vehicle gets too close. See Proximity Sensors.
- Timer — give the participant a set amount of time to walk.
- Key or trigger press — let the participant free roam until a key or controller trigger is pressed.
- Gaze event — end once the participant has looked at a specified object, such as the traffic or pedestrian signal.
- Custom event — end from any other logic in code with
viz.sendEvent(INITIATE_TRIAL_END).
These are chosen in the GUI's trial settings (End condition) or, in the non-GUI version, by replacing the yield viztask.waitKeyDown(' ') line before sightlab.endTrial().
Configurable Trial Conditions
Traffic, vehicle behavior, environment, and audio can all vary by trial — usually driven by a stimulus/condition file like the one above, though conditions can also be set directly in code. Any of these can be stored alongside the participant's gaze and movement data for analysis.
Traffic
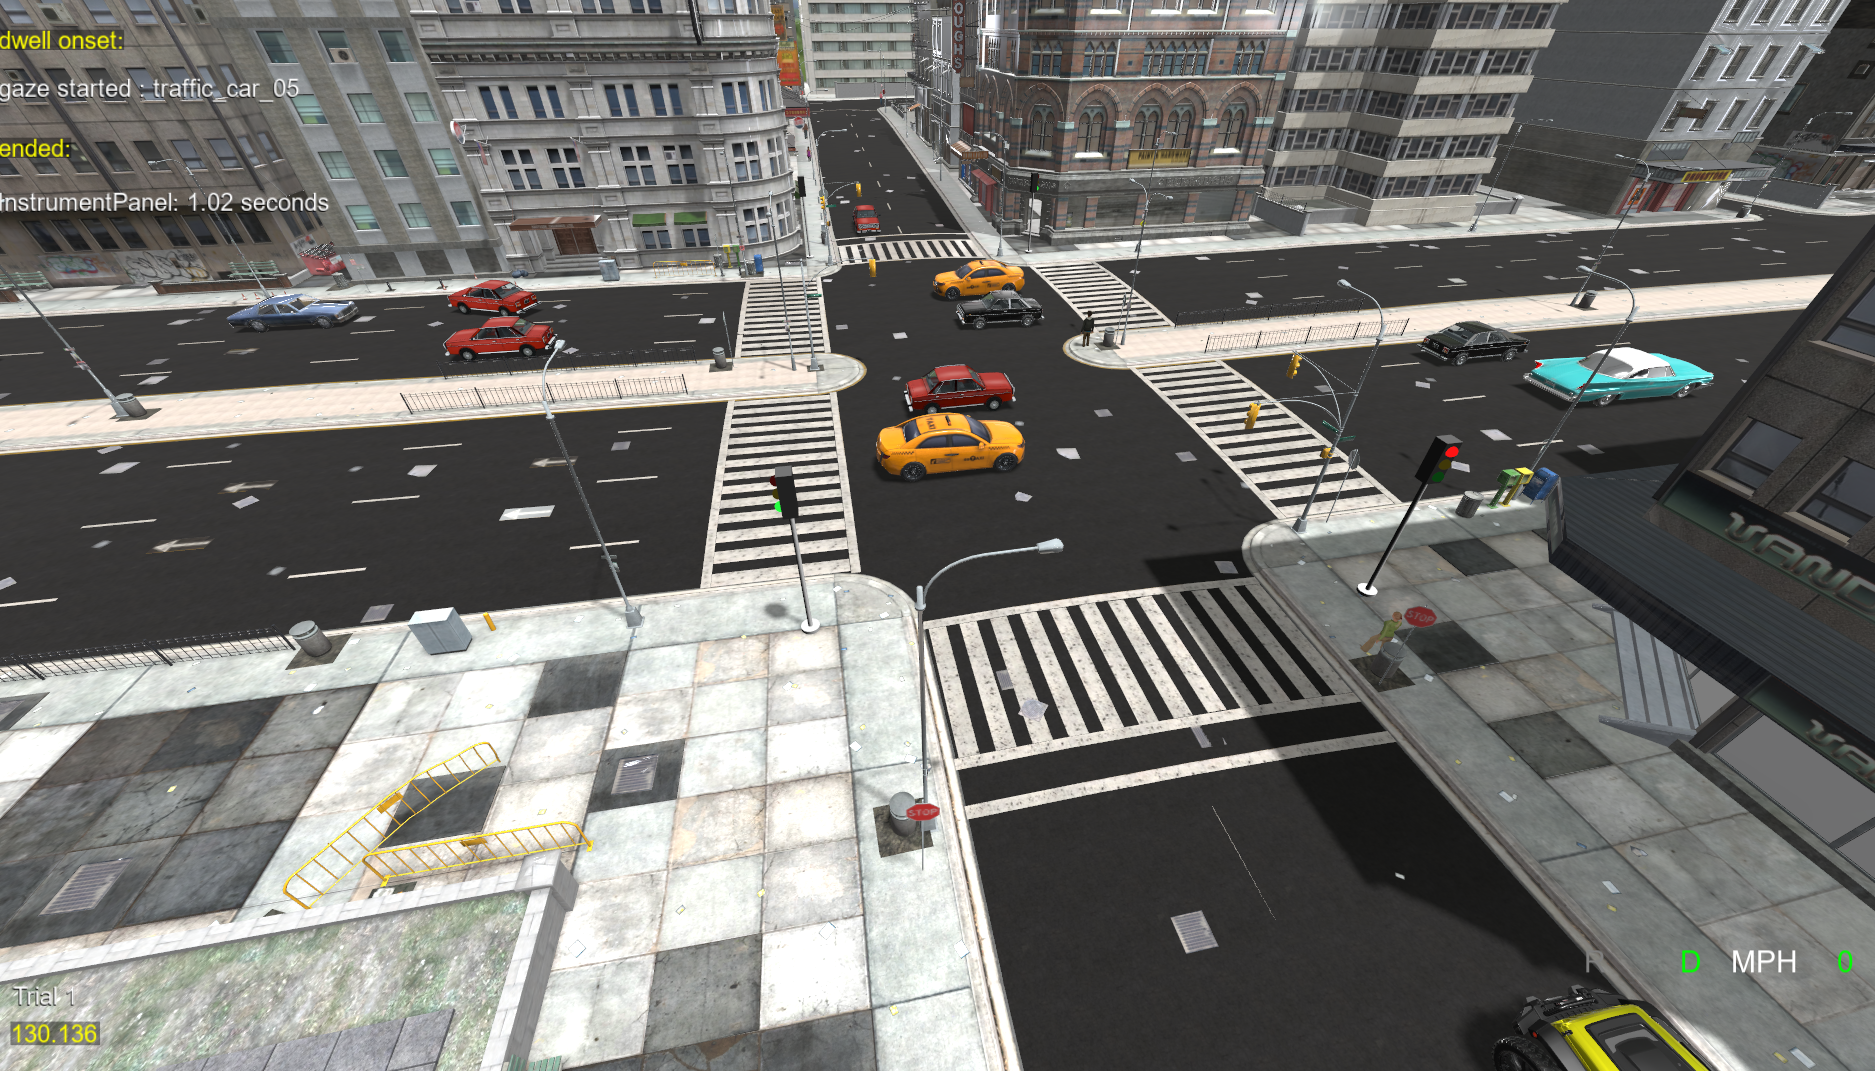
The number of vehicles present (number of vehicles) and whether traffic lights are active (traffic lights) can vary by trial, letting researchers compare low- and high-traffic or signalized and unsignalized conditions and analyze whether, when, and for how long a participant looked at each vehicle. Whether vehicles brake for the participant (yield to pedestrian) is a per-trial condition as well. The mechanics are described under Traffic System.
Additional Pedestrians
Vary number of pedestrians and pedestrian speed to compare optional avatar populations independently of vehicle traffic. See Optional Pedestrian System for setup, participant yielding, routes, and multi-user behavior.
Vehicle Speed
Vehicle speed can be set per trial with the traffic speed column (meters per second) — for example comparing slow, medium, and fast traffic — and examined against changes in gaze behavior or walking speed as vehicles approach. Left blank, each lane uses the speed saved in its route file.
Starting Position & Environment
Where the participant begins, the weather (day/night, fog), lighting, and road or median configuration can all be varied by trial to study how environmental context affects visual search and crossing behavior.
Audio
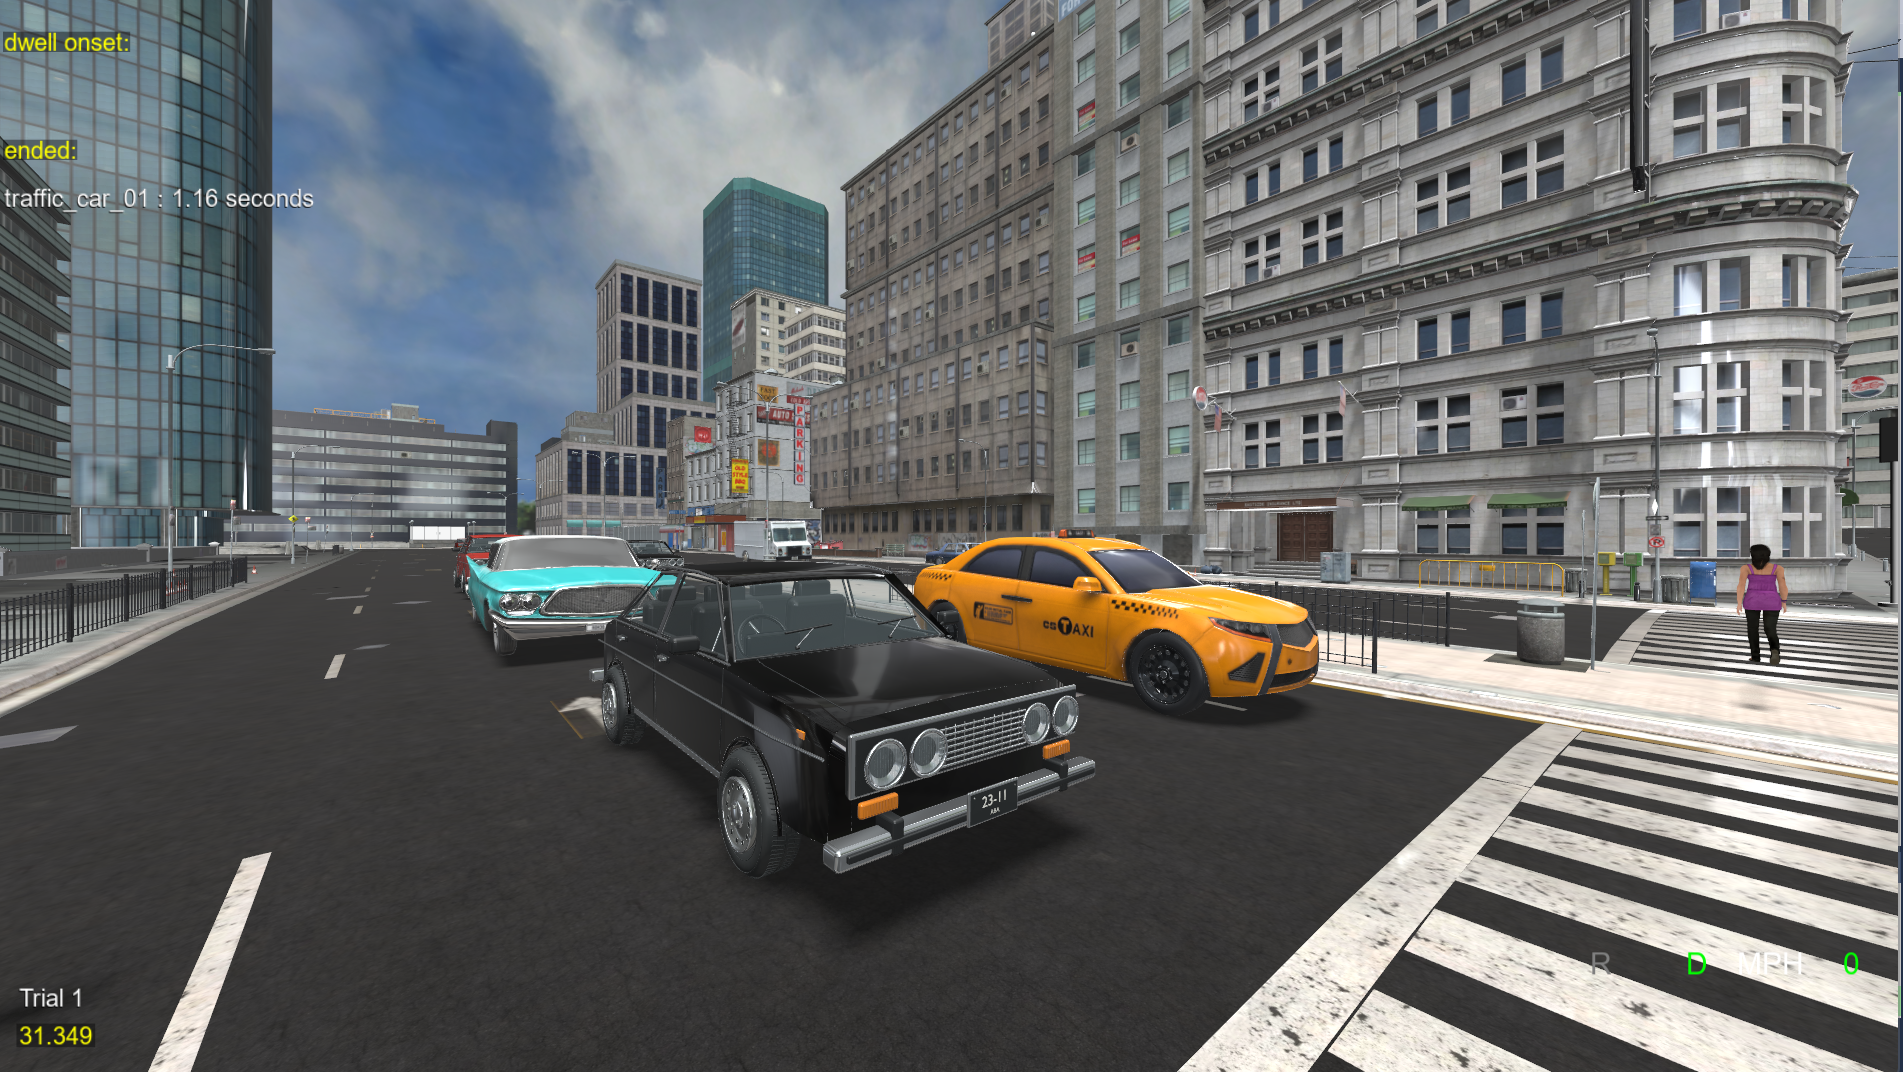
The example includes a looping city-ambience track that plays for the duration of each trial. The same approach can add other layers — traffic noise, horns, sirens, spoken instructions — either as a constant backdrop or as a trial-varying condition.
Traffic System
The example ships with a reusable traffic system (modules/traffic/, configured in traffic_config.py) that gives the street real, controllable traffic flow: vehicles follow the road, keep their distance from each other, obey traffic lights, brake for the participant, and never drive through walls or each other. It works in any environment without a 3D modeling tool, because routes are recorded inside the running experiment.
How it works
The system is kinematic (no physics engine), so it stays cheap even with a dozen vehicles in a large city model:
-
Routes, not physics — each lane is a line recorded along the road and saved as
Resources/traffic/<environment>.json. When a trial starts, the lane is smoothed, resampled every meter, and each sample is snapped to the ground with a single downward ray. Vehicles then follow that baked path, so they sit on the road surface across hills, ramps, and bridges with no per-frame ground raycasts. -
Car following — vehicles in the same lane keep a speed-dependent gap (Intelligent Driver Model) and can never overlap. Vehicles from other lanes that cross or merge ahead are treated as obstacles too.
-
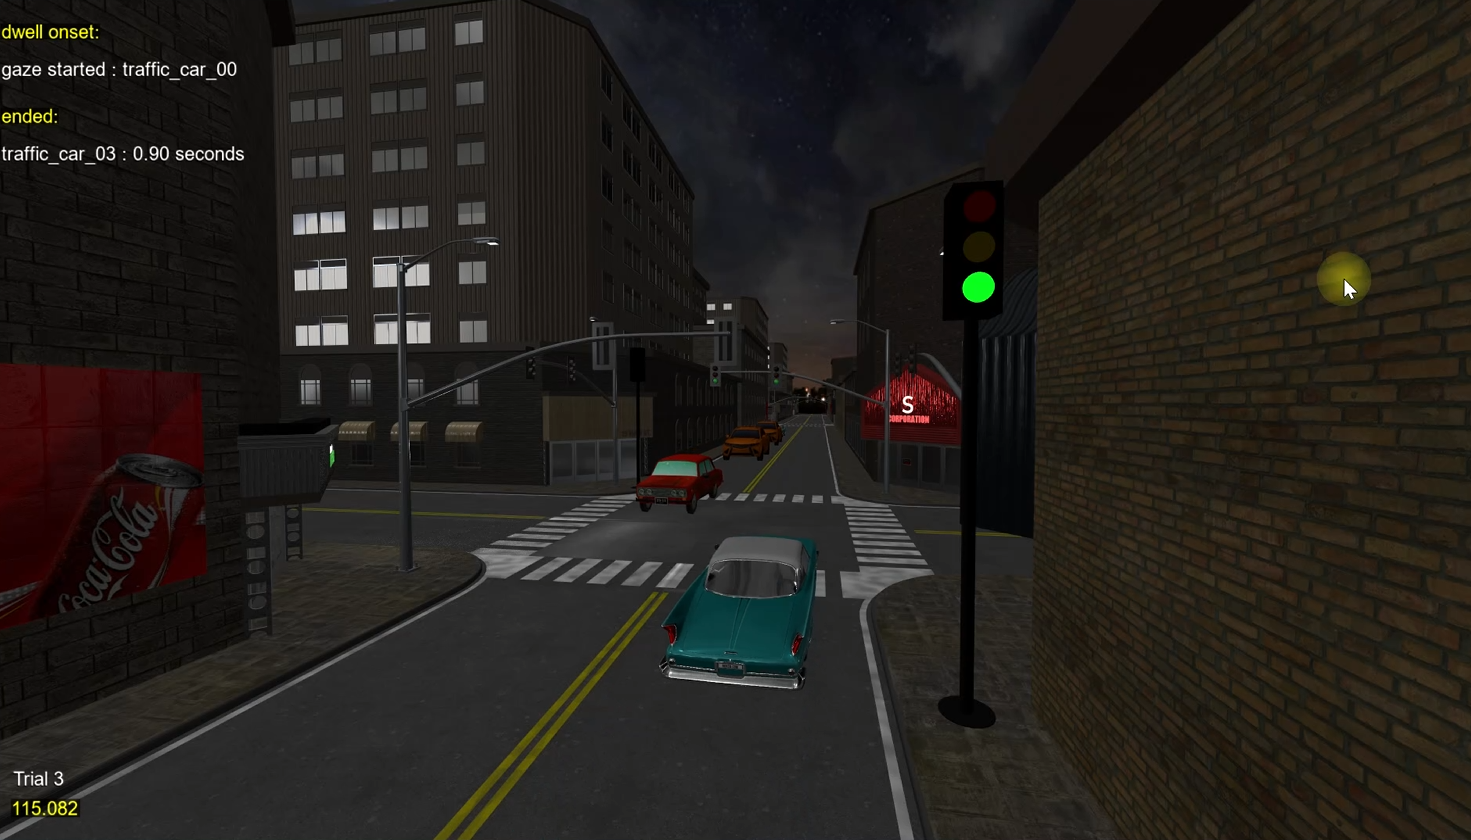
Traffic lights — a stop line on a lane belongs to a signal group of an intersection. Each intersection cycles its groups through green → yellow → all-red, and vehicles queue behind the stop line on red. An intersection with a single group acts as a mid-block pedestrian crossing (the all-red stage is the walk phase). Lights are built procedurally (no model needed) and registered as gaze objects, so looks at the signal are recorded. Each light also carries pedestrian walk / hand signals (see Pedestrian signals).
-
Bumper rays — the same slope-aware raycast sweep as the Driving Example runs ahead of every vehicle along its lane. If a wall, prop, or anything else intersectable is in the way (for example a mis-recorded route), the vehicle brakes instead of passing through, and a console warning names what blocked it.
-
Participant awareness — a vehicle brakes for the participant standing in its lane ahead (
yield to pedestrian). A moving vehicle whose body comes withinHIT_RADIUS(0.3 m) of the participant is a hit: it fires aTRAFFIC_HITevent with a crash sound. One that comes withinCLOSE_PASS_RADIUS(1.2 m), such as a car in the next lane, is recorded as a close pass; every hit is also a close pass. Nearest-vehicle distance is logged every frame, and every change of the traffic lights is recorded.
Pedestrian signals
Every traffic light also carries pedestrian signal heads (walk / hand), placed automatically: there is no extra recording step and nothing to add to the route file, so routes you record later get them too. Each head is mounted about 2.75 m up the pole, below the traffic signal, and faces straight across the crosswalk beside the stop line, so it is read from the opposite curb. At a crossroads, each corner pole gets two heads side by side, one for each crosswalk at that corner, so every crosswalk has a head at both ends.
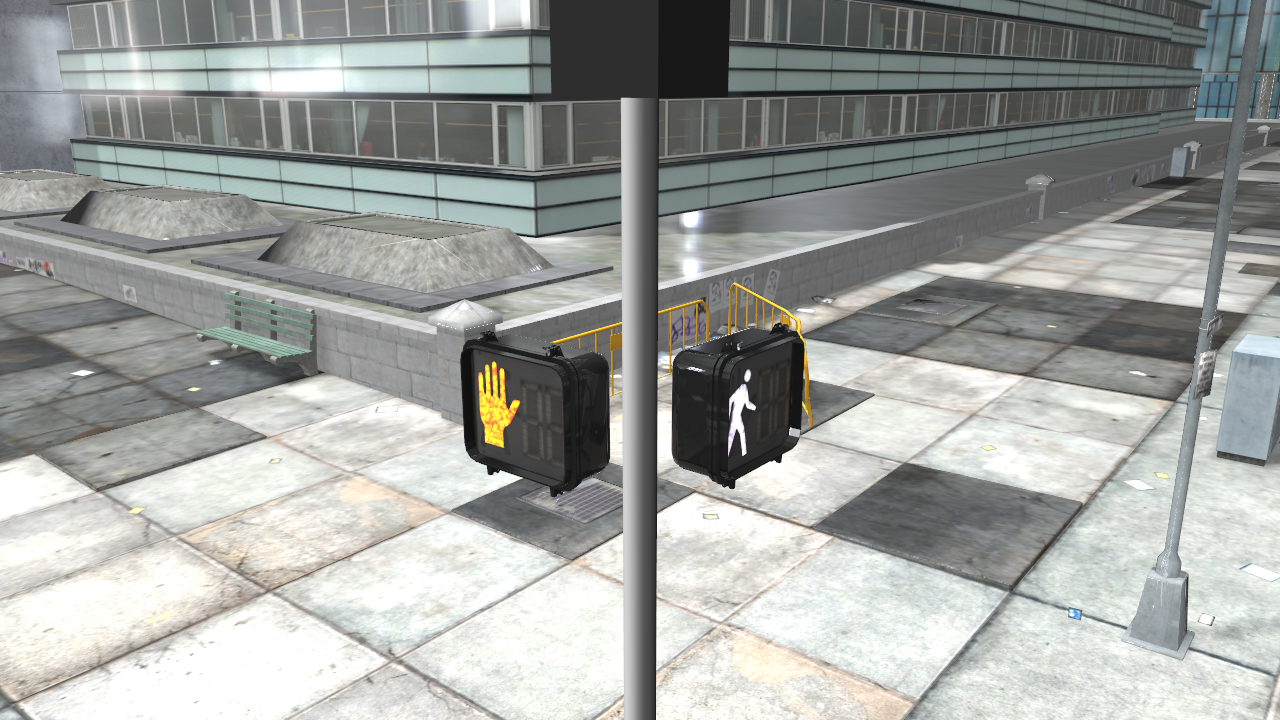
At an intersection of crossing streets, each head follows the traffic running parallel to its crosswalk:
| Parallel traffic | Pedestrian signal |
|---|---|
| Green | Walk |
| Yellow | Flashing hand |
| Red | Steady hand |
At a mid-block crossing (a single signal group, like the included street scene) no traffic runs parallel to the crosswalk, so the all-red stage is the walk phase. The head shows walk first, then the flashing hand for the last few seconds of the all-red (as long as the yellow interval), then a steady hand while vehicles have green or yellow. In a trial with traffic lights set to off, all pedestrian signals go dark.
Each head is registered as its own gaze object, so looks at the walk signal are measured separately from looks at the traffic light. The three models in Resources/pedestrian_signals/ (pedestrian_signal_walk.glb, pedestrian_signal_hand.glb, and pedestrian_signal_empty.glb) are loaded once and shared by every head, and only the one being shown is drawn, so the heads add no measurable cost to frame rate. To use a different signal design, replace those files with your own under the same names, keeping each model's origin at the center of the head and the same facing as the included models.
Recording routes for an environment
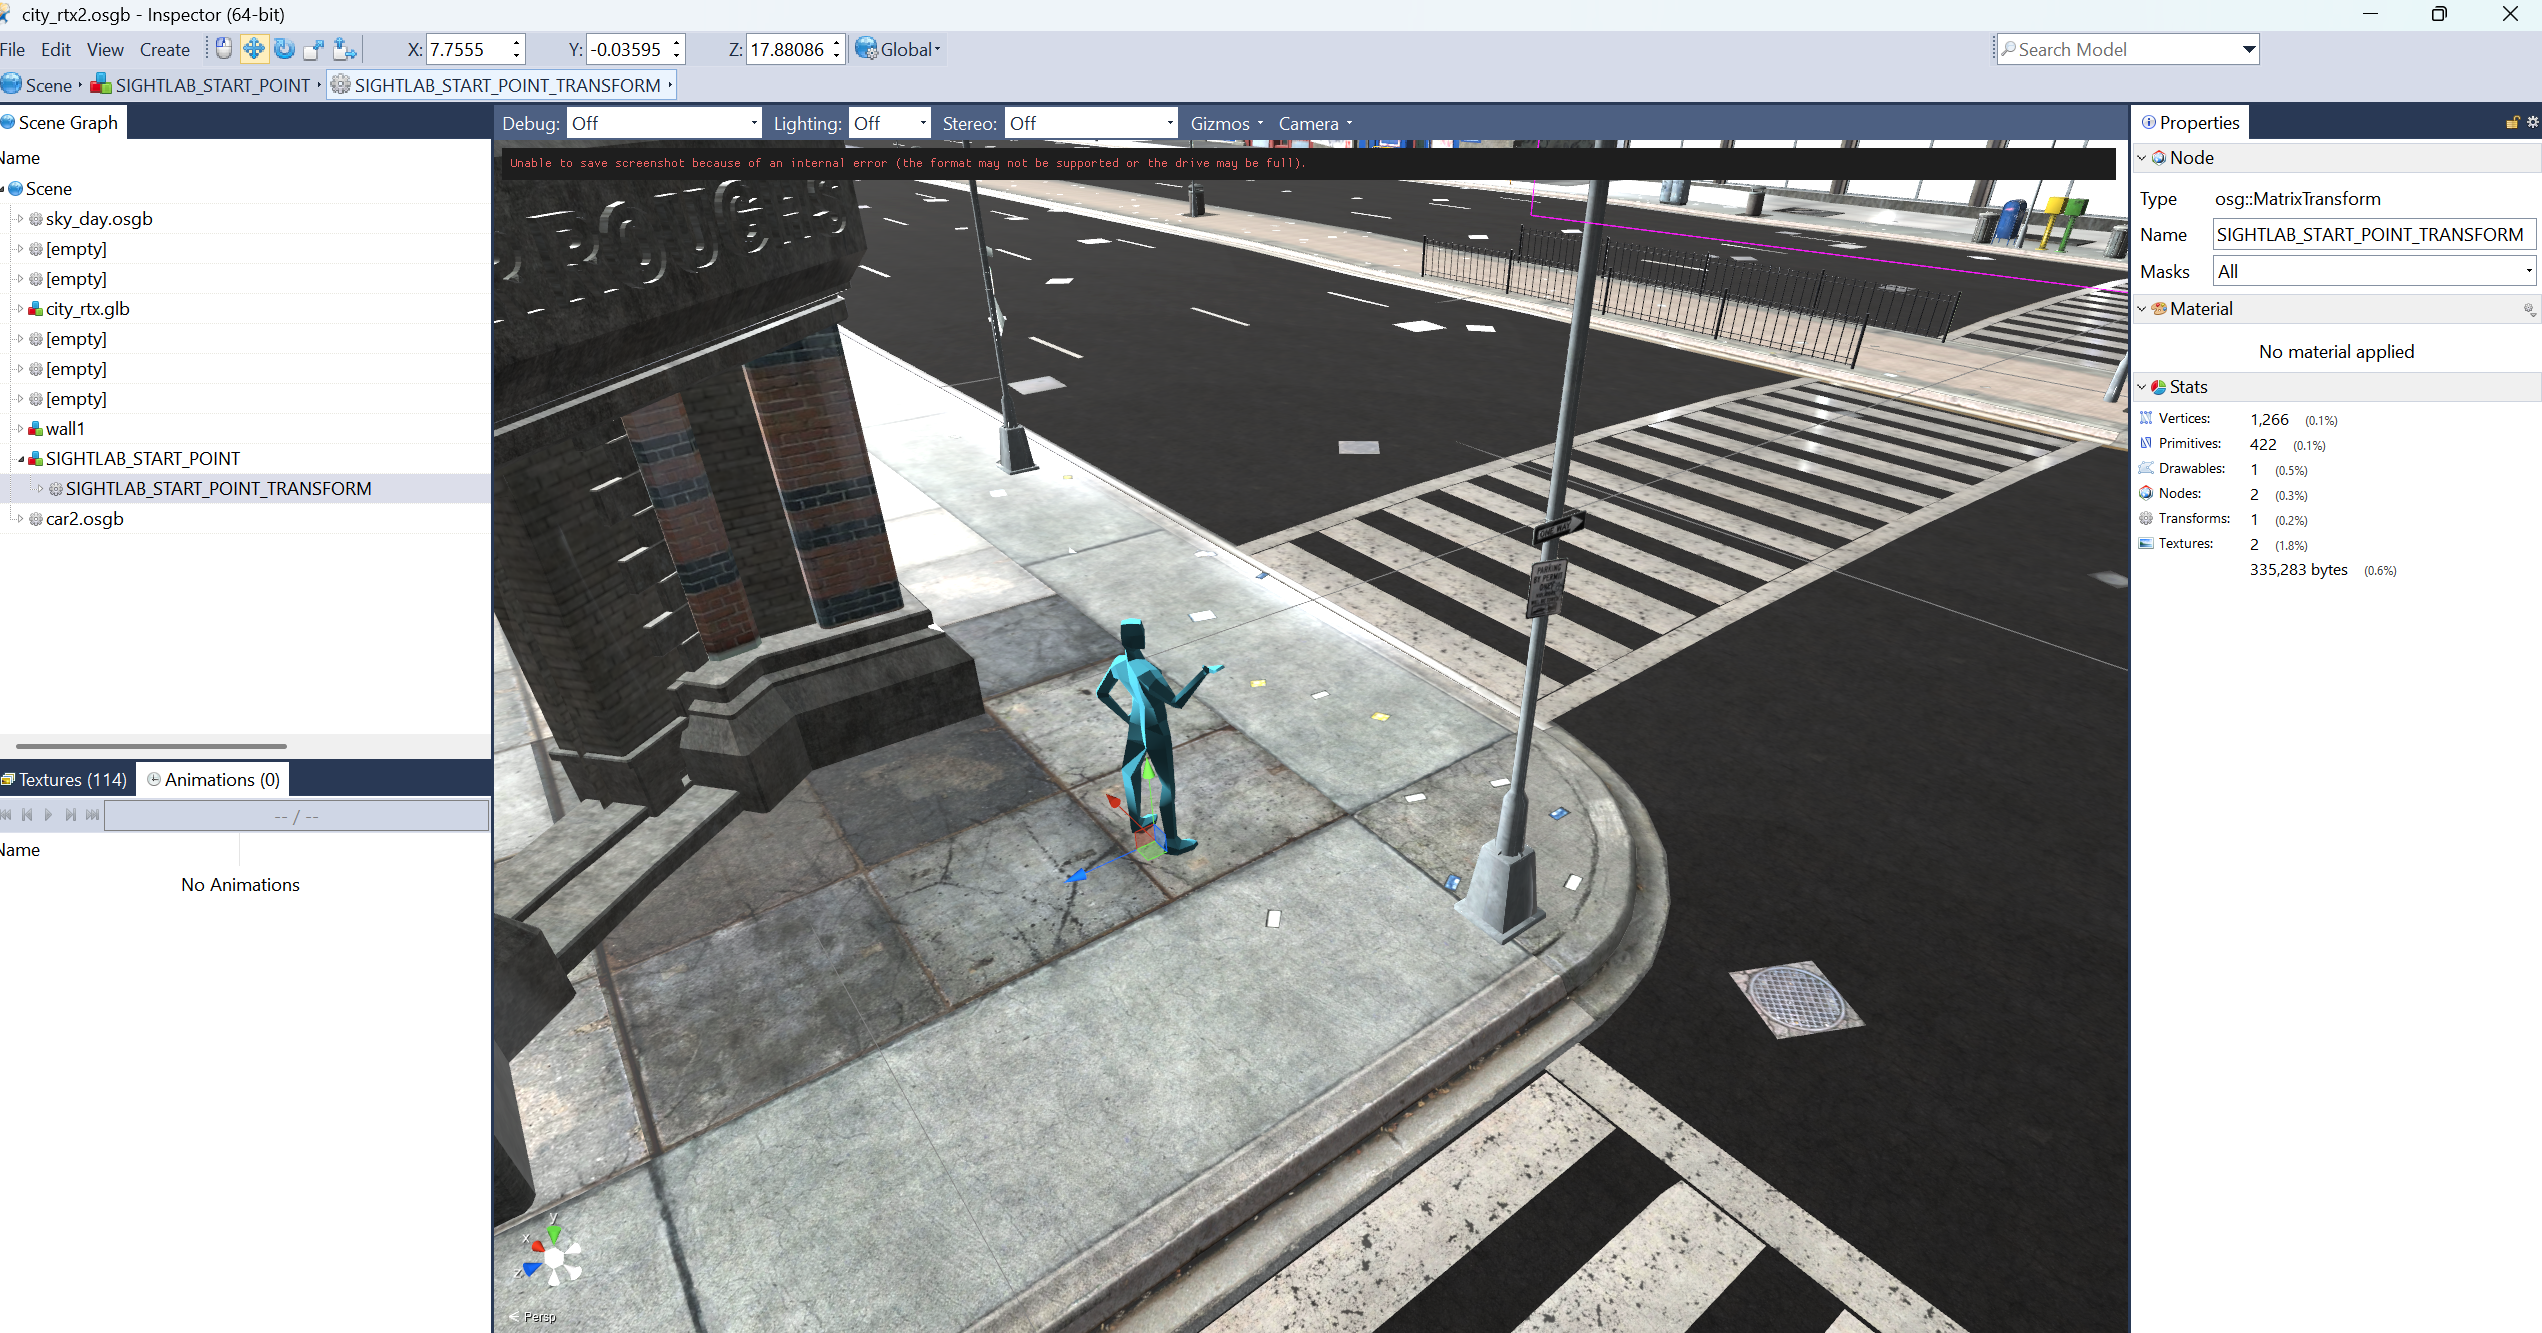
Routes are authored in-app with the route recorder. This is how a new environment (for example city_rtx2.osgb, which ships without a route) gets traffic:
Note: You can also just give your environment model path and this project path to something like Claude Code and GPT Codex and tell it to generate the traffic routes and lights for you, which it can do very effectively and requires no manual work of having to set the routes.
- Set
RECORD_ROUTES = Trueintraffic_config.pyand runStreet-Walking-Sample.py. - Start a trial in the environment, then press F5 to open the recorder (traffic pauses, and the key list appears on screen).
- Walk or fly along a lane in the direction cars should drive, pressing F6 at each bend (or t to drop a waypoint automatically every few meters while you walk). Waypoints are snapped to the ground under you.
- Press F8 to close the lane as a loop, or F9 for an open road whose vehicles respawn at its start. Repeat for the other lanes.
- Stand where cars should stop and press F10: a stop line is added to the last lane and a traffic light is placed at the curb, facing the approaching traffic (its pedestrian signals are added automatically). PAGE DOWN cycles the signal group (A, B, C, D) used for the next stop line, so opposing streets get different groups. INSERT starts a new intersection centered where you stand.
- Press F12 to save. The file is written, re-baked, and traffic starts on it immediately.
| Key | Action |
|---|---|
| F5 | Show / hide the recorder |
| F6 | Drop a waypoint at your position |
| t | Toggle automatic waypoint dropping while walking |
| F7 | Undo the last waypoint |
| PAGE UP | Delete the waypoint nearest to you |
| F8 / F9 | Finish the lane as a loop / as an open road |
| F10 | Add a stop line + traffic light to the last lane |
| INSERT | Start a new intersection at your position |
| PAGE DOWN | Cycle the signal group for the next stop line |
| END / HOME | Raise / lower the last lane's speed by 1 m/s |
| DELETE | Delete the last lane |
| F11 (twice) | Clear everything and start over |
| F12 | Save and reload |
All keys can be changed in RECORDER_KEYS in traffic_config.py, and the on-screen key list can be resized or moved with RECORDER_TEXT_SCALE, RECORDER_TEXT_POSITION and RECORDER_TEXT_ALIGN (it defaults to the top-right corner, clear of SightLab's dwell and trial HUD). Route files are plain JSON and can also be edited by hand; set DEBUG_DRAW_ROUTES = True to draw the loaded lanes, stop lines, and intersections during a normal run. The included street_day.json / street__night.json define two lanes along the street with a signalized crossing in front of the start point, so the example's street trials have traffic out of the box. An environment without a route file simply runs without traffic (a message is printed), so record a route for each other environment you use.
Vehicle models
Every .osgb in Resources/vehicles/ is used as a traffic vehicle; the pool (MAX_VEHICLES, 15 by default) cycles through the files, so adding a model is a matter of dropping it in the folder. Models are re-centered and turned to face the road automatically. If a model drives backwards or is the wrong size, add an override:
VEHICLE_MODEL_OVERRIDES = {'car3.osgb': {'yaw': 180}, 'Taxi.osgb': {'yaw': 180, 'scale': 1.0}}
Vehicles are registered as gaze objects (traffic_car_00 … traffic_car_14), so dwell and fixation data is recorded per vehicle, and they appear in Session Replay.
Per-trial control from the STIM file
The traffic columns in Resources/stim_file.csv (and stim_file-non-GUI.csv) are read for each trial; any column that is missing or blank falls back to the default in traffic_config.py:
| Column | Meaning |
|---|---|
number of vehicles |
How many vehicles from the pool are active (0 to MAX_VEHICLES) |
traffic speed |
Target speed in m/s for every lane (blank = each lane's own speed) |
traffic lights |
on / off — with lights off, crossing lanes yield to each other at the intersection instead |
yield to pedestrian |
on / off — whether vehicles brake for the participant in their lane |
The same settings can be applied in code with traffic.configure({'number of vehicles': 4, 'traffic lights': 'off'}) before traffic.start().
Data recorded
- Raw trial data:
Nearest Vehicle Distance(meters from the participant to the closest vehicle body, every frame), and in the flag column:hit by traffic_car_XXwhen a moving vehicle reaches the participant (withinHIT_RADIUS, 0.3 m);close pass by traffic_car_XXwhen one passes withinCLOSE_PASS_RADIUS(1.2 m);lights <intersection>: <state>at the start of each trial and whenever the lights change, for examplelights crossing: A yellow,lights main: A green, B red, orlights crossing: offin a trial without lights. At the street's mid-block crossing,A redis the walk phase. With these, the data shows which light the participant crossed on.
- Experiment summary:
Traffic Count,Min Vehicle Distance,Vehicle Hits,Close Passes. - BIOPAC: with BIOPAC on, each hit is also sent to AcqKnowledge, under the same
hit by traffic_car_XXlabel as the flag. - Gaze data: per-vehicle, per-light, and per-pedestrian-signal dwell time, view counts, and fixations, like any other gaze object. Lights are named
traffic_light_<intersection>_<group>_<n>and pedestrian signalspedestrian_signal_<intersection>_<light>_<n>. - Events:
viz.getEventID('TRAFFIC_HIT')is sent with the vehicle name, which can end a trial or trigger a rating.
Configuration
The most useful options in traffic_config.py:
ADD_TRAFFIC,RECORD_ROUTES,DEBUG_DRAW_ROUTES— master switch, recorder, and route visualization.MAX_VEHICLES,DEFAULT_VEHICLES,DEFAULT_SPEED_MPS,SPEED_JITTER— pool size and speeds when the STIM file does not specify them.MIN_GAP,TIME_HEADWAY,MAX_ACCEL,COMFORT_DECEL— car-following behavior.GREEN_TIME,YELLOW_TIME,ALL_RED_TIME,STOP_LINE_MARGIN— signal timing (a route file can override the timing per intersection).PED_SIGNALS_ON_POLES,PED_SIGNAL_HEIGHT,PED_SIGNAL_FLASH_PERIOD,PED_SIGNAL_FOLDER— pedestrian signals: on/off switch, height of the center of each head above the foot of the pole (2.75 m), length of one on/off flash of the hand (1 s), and the model folder.CORRIDOR_HALF_WIDTH,PEDESTRIAN_LOOKAHEAD— how vehicles react to the participant.HIT_RADIUS(0.3 m),CLOSE_PASS_RADIUS(1.2 m),HIT_COOLDOWN,HIT_SOUND— how close a moving vehicle's body must come to count as a hit or a close pass, how long before the same vehicle can count again (2 s), and the sound played on a hit.BLOCK_AT_CONTACT— whether a vehicle that is not yielding still stops when it reaches the participant. Off in the walking example, soyield to pedestrian = offproduces recorded hits; on in the driving example, where the player's car is solid and traffic must queue behind it instead of passing through.BUMPER_HEIGHT,BUMPER_RANGE,SLOPE_LIMIT,RAYCAST_EVERY_N_FRAMES,BUMPER_EXCLUDE_NODE_NAMES— bumper rays. Invisible gaze-catcher geometry such ascrate.osgbin the street scenes is excluded by name so it never blocks traffic.RANDOM_SEED— fixed so every run (and every multi-user peer) gets the same vehicle layout.WALKING_SPEED_MODE,WALKING_SPEED_INTERVAL,WALKING_MOVING_THRESHOLD,WALKING_MAX_SPEED,WALKING_FOOT_TRACKERS,WALKING_FOOT_BONES— how the participant's walking speed is measured (see Walking Speed).FREEZE_GC_DURING_TRIALS(True),GC_FREEZE_INTERVAL(1 s) — stop Python's garbage collector from freezing the picture during a trial. SightLab keeps the trial's replay data in memory, and without this the collector's scans freeze the picture for longer and longer as a trial goes on. Replay and trial data are unchanged.PROFILE_FRAMES(False),PROFILE_DELAY,PROFILE_SECONDS— write a report on where each frame's time goes todata/frame_profiles/(Street-Walking-Sample.pyonly). Frames are slower while it profiles, so leave it off for real sessions.
Multi-user and replay
In the server/client scripts the server simulates the traffic and SightLab's scene-object synchronization pushes vehicle positions to every client; the client creates the same vehicle pool with simulate=False. Signal phases come from the server as well, so every participant sees the same traffic lights and pedestrian signals. Session Replay rebuilds the vehicles from their model files and plays back their recorded movement alongside the participant.
Troubleshooting
- "no route file … set RECORD_ROUTES = True" — the environment has no
Resources/traffic/<name>.jsonyet; record one as described above. Traffic is simply disabled for that trial. - "… has been blocked for 5 s by …" — a vehicle's bumper rays are hitting scene geometry. Move the route away from the object, or add the node name to
BUMPER_EXCLUDE_NODE_NAMESif it is invisible helper geometry. - A vehicle drives backwards or floats — add a
yaworscaleentry inVEHICLE_MODEL_OVERRIDES. - Vehicles nose the wrong way on slopes — flip
PITCH_SIGN. - No pedestrian signals on the lights — check
PED_SIGNALS_ON_POLESand that the three.glbfiles are inResources/pedestrian_signals/; a console message names any missing file. - At a crossroads, walk only shows during the all-red — the streets share one signal group, so the pedestrian signals treat the intersection as a mid-block crossing. Give each street its own group when recording (PAGE DOWN) or in the route file.
Optional Pedestrian System
Additional simulated pedestrians can populate the sidewalks while the participant walks through the environment. These animated avatars are separate from the participant and from other human users in a multi-user study. They are supported by Street-Walking-Sample.py, Street-Walking-Sample-NonGUI-STIM.py, and the server/client scripts.
Enable or disable pedestrians
Set the switches in traffic_config.py:
ADD_TRAFFIC = True       # moving vehicles
ADD_PEDESTRIANS = True   # additional simulated pedestrians
Set ADD_PEDESTRIANS = False to disable the additional avatars for the whole experiment, or set number of pedestrians to 0 in a STIM row for a trial without them. Pedestrians can run with ADD_TRAFFIC = False when suitable routes are available. Unlike the Driving Example, this example does not use Driving_Config.py or a car footprint to locate the participant: pedestrian proximity is measured from viz.MainView in the horizontal plane.
Per-trial conditions
The GUI and server/client scripts read Resources/stim_file.csv; the non-GUI script reads Resources/stim_file-non-GUI.csv.
| Column | Meaning |
|---|---|
number of pedestrians |
Number of additional avatars, limited by the loaded pool (MAX_PEDESTRIANS in traffic_config.py); a request above the pool prints a warning and uses the pool's size. Missing or blank uses DEFAULT_PEDESTRIANS (4); 0 disables them for that trial. |
pedestrian speed |
Base avatar walking speed in m/s. Missing or blank uses PEDESTRIAN_SPEED_MPS (1.2). PEDESTRIAN_SPEED_JITTER adds per-avatar variation (default ±25%). |
These settings control the simulated pedestrians, not the participant's walking speed. For example, compare trials with 0, 3, and 6 additional pedestrians while keeping vehicle traffic constant. Avatars are placed and begin walking at trial start; they stop and are hidden at trial end.
Walking and yielding to the participant
Avatars walk between waypoints using vizact.walkTo, looping around closed routes or turning around at the ends of open routes. When the participant is nearby and close to an avatar or its current path segment, the avatar pauses and plays its idle animation. It resumes after the way has stayed clear for PEDESTRIAN_RESUME_DELAY (1 second by default).
Tune PEDESTRIAN_YIELD_DISTANCE (12 m) and PEDESTRIAN_YIELD_CLEARANCE (2.5 m) for the spacing needed in your walking study. Both the proximity range and clearance test are used; avatars do not stop merely because the participant enters the 12 m range. PEDESTRIAN_STUCK_TIME and PEDESTRIAN_STUCK_SPEED control recovery: an avatar that cannot make progress turns around.
The STIM column yield to pedestrian controls vehicles braking for the human participant. It does not toggle these additional avatars or their yielding behavior. Vehicles are not set up to yield to the avatars, and the avatars' sidewalk walking does not implement general crowd obstacle avoidance.
Crossing at traffic signals
When traffic is running (ADD_TRAFFIC = True), the avatars obey the traffic lights. An avatar whose path crosses a signalized lane near its stop line stops at the curb and plays its idle animation until every lane it is about to cross has a red light, then walks across. Once it has stepped into the road it keeps going. Avatars follow the vehicle lights rather than the pedestrian signals, so one can start crossing while the pedestrian signal still shows a flashing or steady hand, for example during the all-red. In trials with traffic lights set to off, avatars cross without waiting.
The related settings in traffic_config.py are:
PEDESTRIAN_OBEY_SIGNALS— set toFalseto have avatars ignore the lights.PEDESTRIAN_ROAD_HALF_WIDTH,PEDESTRIAN_SIGNAL_MARGIN— how far from a lane's center counts as roadway (3 m), and how far outside it avatars wait (1 m).PEDESTRIAN_SIGNAL_RANGE— how close to a stop line (25 m) a crossing must be to count as signalized; lanes crossed farther away, or without a stop line, are crossed without waiting.
Sidewalk routes
The system first looks for Resources/traffic/<environment>_pedestrians.json, for example street_day_pedestrians.json. This uses the same lane JSON format as traffic routes, with each lane's waypoints and loop flag defining a walking path. Supply a dedicated file for precise sidewalk placement.
The example ships street_day_pedestrians.json and street__night_pedestrians.json for the two street scenes. Their sidewalks are only about 1 m wide, so a path along the near sidewalk would pass the participant's start point, and the nearest avatar would stand waiting there until the participant moved away. The included paths run the full far sidewalk and stop the near one short of the start corner on both sides.
If no dedicated file exists, paths are derived from the environment's vehicle route file. Waypoints are offset to the right of each lane's travel direction, ground-snapped, and adjusted using curb and wall checks. This fallback requires a vehicle route file even when moving traffic is disabled. Set PEDESTRIAN_LANE_OFFSET = 0 to disable automatic derivation; without usable routes, no pedestrians walk in that environment.
Useful placement settings in traffic_config.py include:
PEDESTRIAN_LANE_OFFSET,PEDESTRIAN_CURB_SEARCH,PEDESTRIAN_SIDEWALK_MARGIN— locate the derived sidewalk path.PEDESTRIAN_WALL_CLEARANCE,PEDESTRIAN_MIN_LANE_OFFSET,PEDESTRIAN_MAX_SNAP_DELTA— constrain placement near walls and changes in ground height.PEDESTRIAN_SPAWN_CLEAR_RADIUS,PEDESTRIAN_SPAWN_SEPARATION— preferred initial clearance and spacing. Limited route space may require closer placements.PEDESTRIAN_SPAWN_NEAR_CAR— despite its inherited name, this prefers spawn points near the walking participant in this example.
Avatar models, gaze, and replay
Place animated .cfg or .osgb avatar models in Resources/pedestrians/. Configure each model's idle and walk animation IDs in PEDESTRIAN_ANIMATIONS; unlisted files use PEDESTRIAN_DEFAULT_ANIMATIONS (idle 1, walk 2). The included RocketBox_Female1.osgb uses idle 1 and walk 5. PEDESTRIAN_MODEL_OVERRIDES supports per-model scale adjustments, and PEDESTRIAN_DISABLE_LIGHTING controls the default lighting override for avatars that render too dark.
Avatars are registered as scene objects named pedestrian_00, pedestrian_01, etc., for recording and replay. PEDESTRIAN_GAZE_OBJECTS = True enables dwell and fixation measurements on them in single-user sessions. Pedestrian gaze registration is automatically disabled in multi-user sessions.
In the server/client version, the server simulates the additional pedestrians and synchronizes their transforms; clients select walk or idle animations from the synchronized movement. Keep avatar models, configuration, and STIM conditions consistent across machines. On the server, vehicles and pedestrians yield to, and spawn clear of, every connected client's head rather than the server's own camera.
Troubleshooting
- No additional pedestrians: check
ADD_PEDESTRIANS, the current STIM count, the avatar folder, and the environment's pedestrian or vehicle route file. The supplied first GUI STIM row intentionally has a count of 0. - Avatars slide or play the wrong animation: verify their idle/walk animation IDs.
- Avatars walk near walls or in the road: adjust the sidewalk settings or supply dedicated routes.
walkTodoes not provide general obstacle avoidance. - Avatars stop too far away: reduce the yielding distance or clearance for the intended participant interaction.
- Avatars cross against the lights: check
PEDESTRIAN_OBEY_SIGNALS, thatADD_TRAFFICis on and the trial'straffic lightsison, and that the crossing lies withinPEDESTRIAN_SIGNAL_RANGEof a stop line.
Eye Tracking and Visual Attention
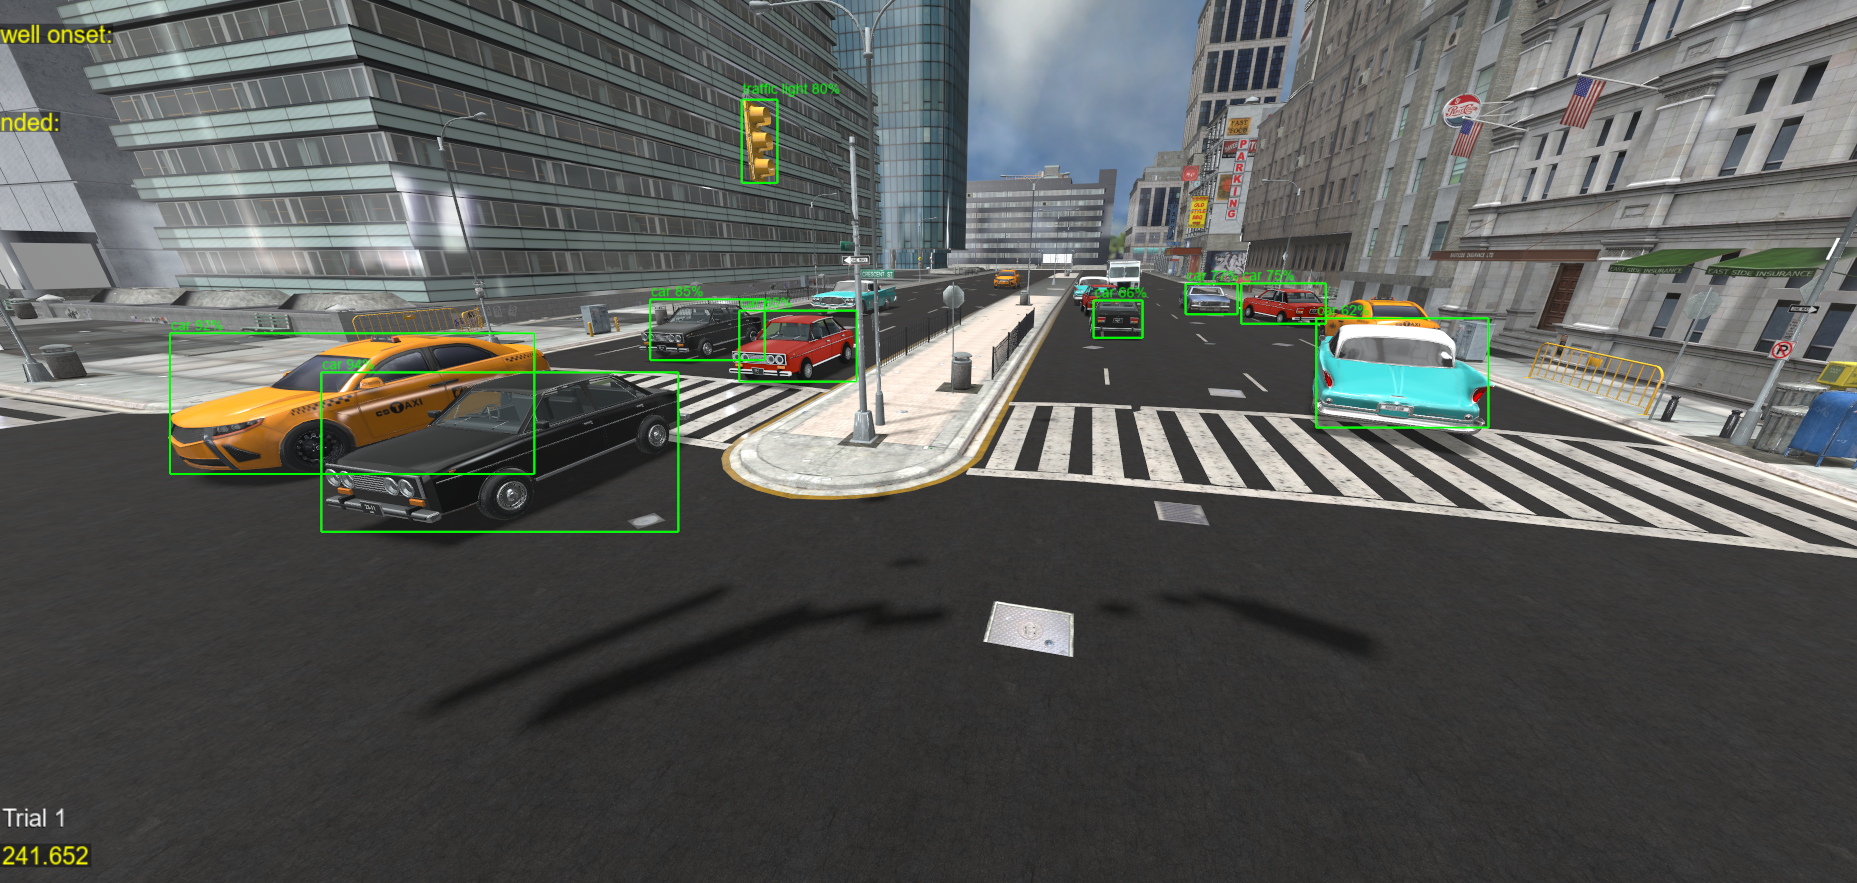
Vehicles and other objects in the environment can be registered as gaze-tracked Regions or Objects of Interest, which is what lets SightLab associate a participant's gaze behavior with specific objects — crosswalks, signs, buildings, or approaching traffic.
This makes it possible to analyze, for any registered object, whether it was viewed, how long, how many separate times, and when during the trial.
By default vehicles and pedestrians added to the vehicle and pedestrian resources folders will be added as gaze objects, as are the traffic lights and pedestrian signals. You can also use the built-in computer vision AI object detection in SightLab to automatically tag objects. See this page for more information on that.
Participant Movement
SightLab records the participant's tracked movement through the environment, making it possible to reconstruct not only what someone looked at, but also where they were and how they moved while looking at it.
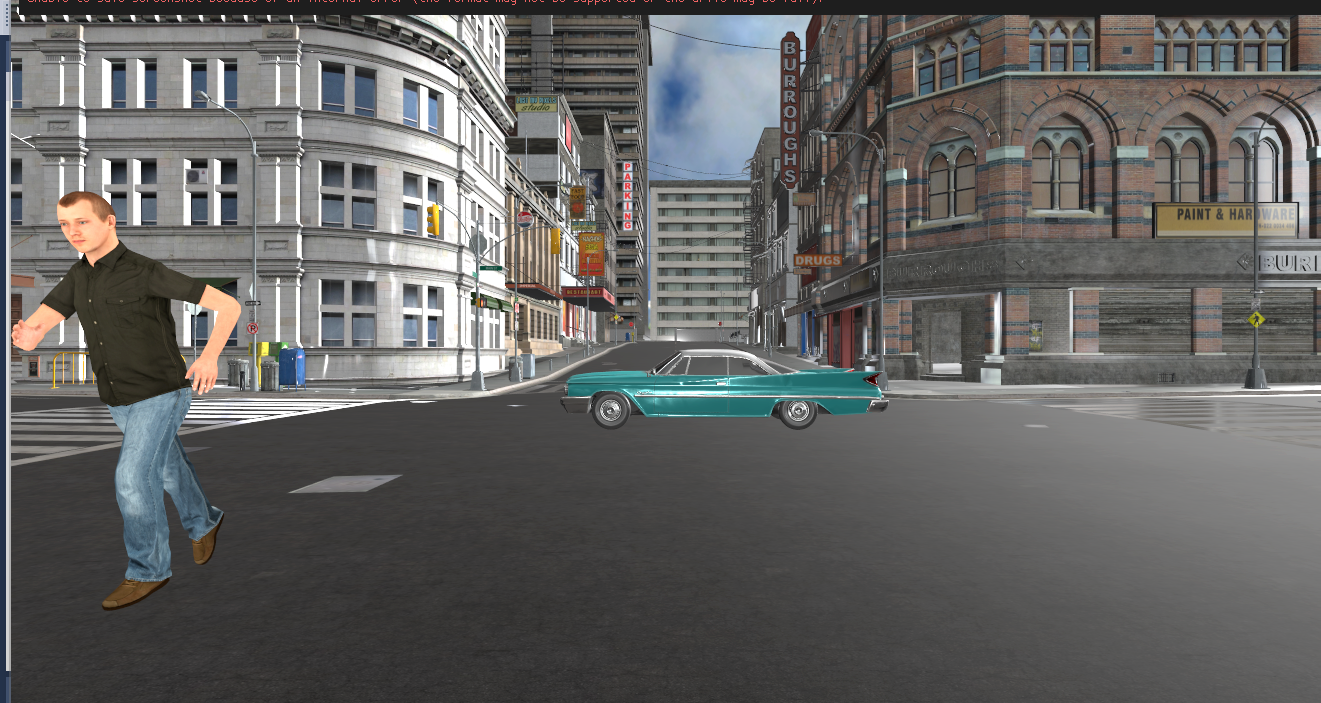
Recorded and derived measures include:
- Walking path and position over time
- Direction of travel and movement velocity
- Stops, pauses, and turning behavior
- Relationship between participant and vehicle position
This can be tracked using standard head and hand tracking, or extended to full-body tracked avatars for studies that need whole-body posture and movement.
The participant follows the ground: they step up and down curbs and stay on the street surface. One ground follower runs for the whole session (modules/ground_follow.py), and its rays pass through the vehicles, the pedestrians, and the participant's own hands and controllers, so a car driving through the participant or a hand held low never becomes their floor.
This is particularly useful for pedestrian research because gaze and movement can be examined on the same timeline. For example:
A participant slows while approaching the curb, looks left toward a fast-moving vehicle, waits for the vehicle to pass, and then continues across the street.
SightLab's recorded data and Session Replay allow these events to be examined together.
Walking Speed
modules/walking_speed.py records the participant's walking speed:
| Column | Where | What it records |
|---|---|---|
Walking Speed MPH |
Trial data, every frame | The current walking speed |
Average Walking Speed MPH |
Experiment summary | The trial's average walking speed |
Average Moving Speed MPH |
Experiment summary | The average over the time spent moving only, so that waiting at a curb doesn't read as slow walking |
How the speed is measured is set with WALKING_SPEED_MODE in traffic_config.py:
'distance'(default) — the distance walked divided by the time, from the head's position sampled everyWALKING_SPEED_INTERVALseconds. It is weighted by time, sway between samples mostly cancels out, and an interval slower thanWALKING_MOVING_THRESHOLDcounts as standing still.Walking Speed MPHis the speed over the latest interval.'head'— the head's speed from one frame to the next, averaged over the frames. This is the method earlier versions of the example used; choose it to compare with data collected with them. It is biased in two ways. Every frame counts the same however long it took, so stretches with a low frame rate count for less than their share of the time. And head sway, turning, and leaning all count as walking, so a participant standing still shows some speed.-
'feet'— the same as'distance', measured from the point between the participant's feet. It works with any foot-tracking hardware, and takes the feet from the first of these sources that has data:- Nodes your script passes to
walkingSpeed.set_foot_nodes([leftFoot, rightFoot]). Any Vizard node works, so this covers any hardware a script can read. - The vizconnect trackers named in
WALKING_FOOT_TRACKERS, such as Vive trackers on the feet (['l_foot_tracker', 'r_foot_tracker'], as named in your vizconnect configuration), or controllers strapped to the feet (['l_hand_tracker', 'r_hand_tracker']). - The OptiTrack skeleton's foot bones in
WALKING_FOOT_BONES, through SightLab's OptiTrack direct mapping withFULL_OPTITRACK_DATAon.
One foot is enough. With a single foot, positions are sampled at least once a second (about one stride), so a foot that is planted mid-step isn't counted as standing still. Whenever no foot data arrives, the mode measures the head instead and prints a message in the console, so a missing or misnamed tracker doesn't stop the experiment. It needs real foot tracking: without it, a full-body avatar's feet are worked out from the head, so they add nothing over
'distance'. This mode has not yet been tested with foot-tracking hardware. - Nodes your script passes to
Average Moving Speed MPH comes from the sampled positions in every mode (the head's in 'head' mode). Intervals faster than WALKING_MAX_SPEED, such as a teleport or a reset of the view, are left out of 'distance', 'feet', and the moving speed.
| Setting | Default | What it does |
|---|---|---|
WALKING_SPEED_MODE |
'distance' |
'distance', 'head', or 'feet' (see above) |
WALKING_SPEED_INTERVAL |
0.5 |
Seconds between position samples |
WALKING_MOVING_THRESHOLD |
0.25 |
Meters per second. Slower than this over an interval counts as standing still. |
WALKING_MAX_SPEED |
8.0 |
Meters per second. Faster intervals are treated as teleports or view resets, and left out. |
WALKING_FOOT_TRACKERS |
[] |
'feet' mode: names of the vizconnect trackers on the feet |
WALKING_FOOT_BONES |
['Bip01 L Foot', 'Bip01 R Foot'] |
'feet' mode: the avatar bones that OptiTrack drives |
Data Collection and Export
SightLab records experiment data that can be exported for additional analysis. The data pipeline can include several complementary files rather than only a single summary spreadsheet:
Raw Tracking Data
Frame-by-frame or sample-level information used to reconstruct the participant's session — head/user position and orientation, eye gaze, gaze intersection, tracked objects, walking speed (see Walking Speed), nearest-vehicle distance, and trial time.
Eye-Tracking Data
Depending on the eye tracker and configuration: gaze position/direction, gaze intersections, fixations, saccades, dwell behavior, and view counts.
Fixation Data
SightLab performs fixation/saccade analysis and generates fixation-specific timeline information — location, timing, duration, and sequence of visual attention.
Trial Timeline
A chronological representation of events during the trial, useful for relating:
Participant movement
        ↓
Vehicle approaches
        ↓
Participant fixation on vehicle
        ↓
Participant slows/stops
        ↓
Vehicle passes
        ↓
Participant continues walking
Experiment Summary
Aggregated metrics and custom experiment values, e.g.:
Participant_ID
Trial
Weather
Traffic_Count
Vehicle_Speed
Min_Vehicle_Distance
Vehicle_Hits
Close_Passes
Average_Walking_Speed
Average_Moving_Speed
Rating
Replay Data
SightLab also saves the information necessary to reconstruct the session inside Session Replay.
The exported data can subsequently be analyzed using tools such as Python, R, MATLAB, Excel, SPSS, or custom research pipelines.
Session Replay
One of the major advantages of the Street Walking Example is that a session doesn't have to be understood only through spreadsheets — SightLab Session Replay reconstructs the participant's recorded session inside the original virtual environment, and researchers can move through the replay timeline to inspect gaze and movement spatially.
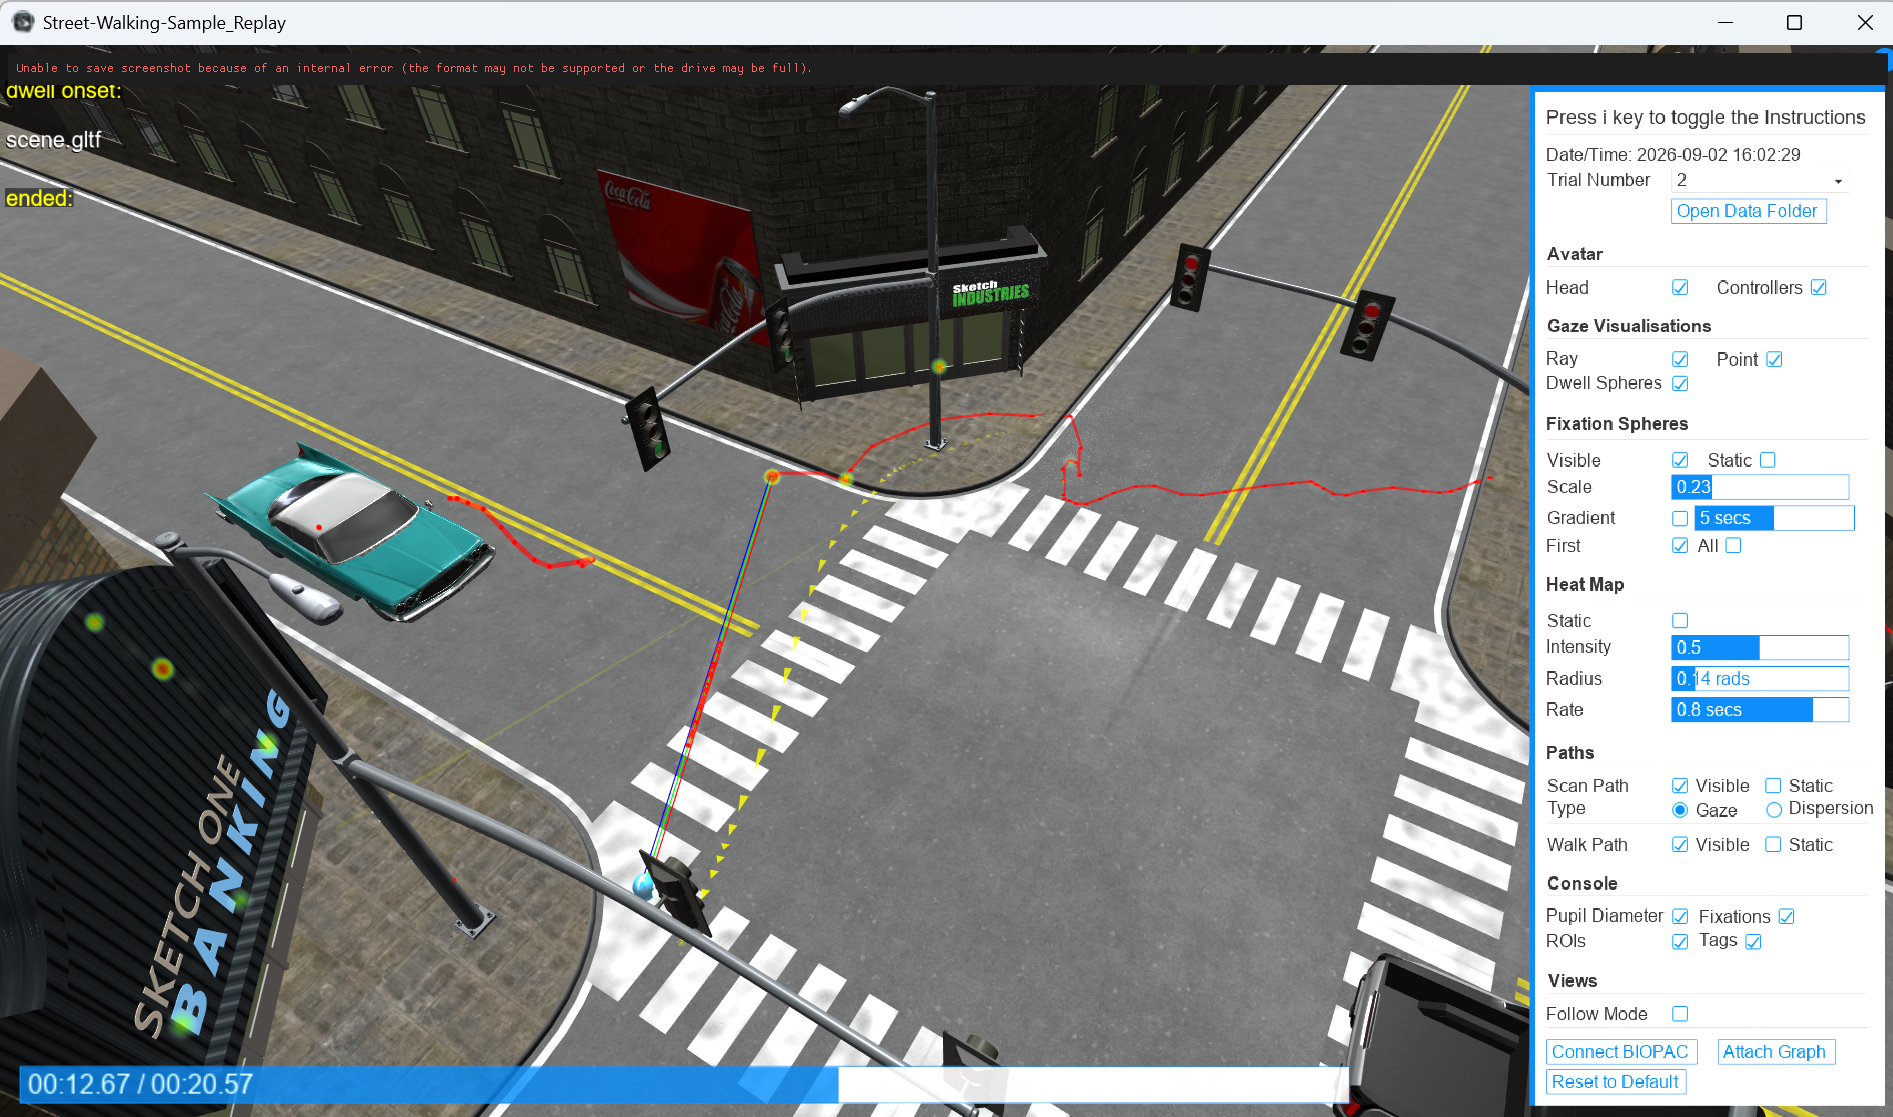
Replay supports several visualization modes, which can be toggled and combined:
Walk Paths
Shows the participant's physical trajectory through the street environment in 3D, instead of examining only X/Y/Z values in a spreadsheet. This makes behaviors like curb hesitation, stepping toward the roadway and backing away, or route deviations immediately visible.
Scan Paths
Shows how visual attention moved through the scene over time — for example crosswalk → approaching car → traffic light → opposite sidewalk. This answers not just what was viewed, but in what order, which can reveal the strategies participants use to decide whether it's safe to cross.
Fixations
Visualizes calculated fixation locations in the environment, alongside fixation duration, sequence, and the object being fixated on — useful for examining a participant's visual decision-making process as they move through the scene.
Heatmaps
Aggregates visual attention into a heatmap over the scene, useful for quickly seeing whether participants are primarily looking at vehicles, checking the traffic signal, or scanning the roadway more broadly under different conditions.
Multiple Participants
Because SightLab Replay is also built for multi-user recordings, the same framework can show multiple participants' walk paths and gaze simultaneously — useful for pedestrian-to-pedestrian interaction, group navigation, or shared decision-making studies.
Multi-User Studies
The Street Walking workflow can natively use SightLab's server/client multi-user architecture via the included Street-Walking-Sample_Server.py and _Client.py.
These scripts extend the same setup — traffic, audio, and gaze tracking work the same way as the single-user version, with SightLab's server/client framework keeping participants synchronized. The server simulates the traffic and its vehicle positions are synchronized to every client, so all participants see the same cars. Optional additional pedestrians also use server-driven transforms; see Optional Pedestrian System for animation, gaze tracking, and participant-yielding details.
Possible applications include:
- Two pedestrians deciding when to cross together
- Social influence on crossing behavior
- Pedestrian/driver experiments
- Instructor and participant scenarios
Because this is built on SightLab's multi-user framework, the study can also take advantage of SightLab's other multi-user features, including avatars, synchronized trials, presentation control, and multi-user replay.
Participant Input: Ratings, Instructions & Demographics
None of the following are wired into the base Street Walking sample, but they're standard SightLab patterns that fit naturally into the same trial loop shown above.
Rating Scales
For example, after crossing the street:
yield sightlab.showRatings(
    "How safe did you feel crossing the street?",
    ratingScale=["1", "2", "3", "4", "5"],
    pauseTimer=True
)
Rating responses are saved with the participant's experiment data, and can answer questions like how safe or realistic a crossing felt, or how confident the participant was in their decision.
Instructions
SightLab's normal instruction system can display text such as:
Walk along the sidewalk. When you believe it is safe, cross the street and continue to the marked destination.
Instructions can be shown at the start of the experiment, before individual trials, between conditions, or before a questionnaire.
Demographics
SightLab examples demonstrate using input dialogs to collect demographic or questionnaire information and save it into the experiment summary — for example age, driving experience, walking frequency, or VR experience — so it can be combined with behavioral and eye-tracking measures during analysis.
Other SightLab Features
Because the Street Walking study is a normal SightLab experiment, it isn't limited to the functionality demonstrated in the base sample. Capabilities commonly relevant to pedestrian and traffic studies include:
- Regions of Interest, dwell time, and view counts
- Gaze-based interactions and object grabbing
- Hand, foot, and face tracking; full-body avatars
- Trial randomization and adaptive experiments
- External data synchronization (e.g. Lab Streaming Layer, BIOPAC)
- Screen recording and custom experiment events
- Custom Python libraries and experiment logic
The full platform feature set is covered in the SightLab Documentation.
Example Research Questions
Visual Attention
- When does a participant first notice an approaching vehicle?
- Which objects receive the greatest fixation time?
- Does visual search behavior change as vehicle speed increases?
Pedestrian Movement
- Where does the participant stop before crossing, and how long do they hesitate?
- Do participants check the walk signal before stepping off the curb, and do they still start crossing on a flashing hand?
- Does their walking velocity change when a vehicle approaches?
Traffic
- Does increasing traffic density affect crossing decisions?
- How does vehicle speed affect visual attention?
Environmental Conditions
- Does night or fog alter walking speed or fixation duration?
Multi-User Behavior
- Does another pedestrian influence crossing behavior?
- Where do users look during social interaction?
Example Study Workflow
A complete Street Walking experiment could follow this workflow:
1. Collect participant information
            ↓
2. Show experiment instructions
            ↓
3. Load experimental condition
   • Traffic count
   • Vehicle speed
   • Weather
   • Audio
            ↓
4. Start SightLab recording
            ↓
5. Participant walks through street
            ↓
6. Record simultaneously
   • Eye tracking / fixations
   • Head/user movement and position
   • Traffic and vehicle behavior
   • Trial events
            ↓
7. End trial
   • Waypoint reached, timer, key press, or combination
            ↓
8. Present rating scale/questionnaire
            ↓
9. Continue to next condition
            ↓
10. Export experiment data
            ↓
11. Open Session Replay
            ↓
12. Analyze walk paths, scan paths, fixations, heatmaps, and trial summaries
Related SightLab Documentation
For additional information, see the SightLab documentation:
- SightLab Documentation: https://help.worldviz.com/sightlab/
- Session Replay: https://help.worldviz.com/sightlab/session-replay/
- Example Scripts: https://help.worldviz.com/sightlab/example-scripts/
- Adding Instructions: https://help.worldviz.com/sightlab/adding-instructions/
- Multi-User Custom Experiments: https://help.worldviz.com/sightlab/multi-user-custom-experiments/
- Proximity Sensors: https://help.worldviz.com/sightlab/proximity-sensors/
- Using a Timer for Experiment: https://help.worldviz.com/sightlab/using-a-timer-for-experiment/
- Driving / Vehicle Examples: https://help.worldviz.com/sightlab/driving-example/
Summary
The Street Walking Example demonstrates how a pedestrian VR experiment can combine moving traffic, audio, eye tracking, participant movement, raw data collection, and interactive Session Replay in one research workflow, starting from a small, concrete base script.
The experiment can scale from a relatively simple single-user crossing study — as shipped — to a multi-condition or multi-user research platform by adding more conditions to the same trial-based pattern.
After data collection, researchers can move beyond spreadsheets and reconstruct the participant's experience directly in the virtual environment: where they walked, where they looked, what they fixated on, and how those behaviors related to traffic and experimental conditions.